Популярное

Музыка Кино и Анимация Автомобили Животные Спорт Путешествия Игры Юмор

Интересные видео

2025 Сериалы Трейлеры Новости Как сделать Видеоуроки Diy своими руками

Топ запросов

смотреть а4 schoolboy runaway турецкий сериал смотреть мультфильмы эдисон
dTub
Скачать

#Tableau

Автор: Andy Kriebel

Загружено: 2022-10-05

Просмотров: 5063

Описание:

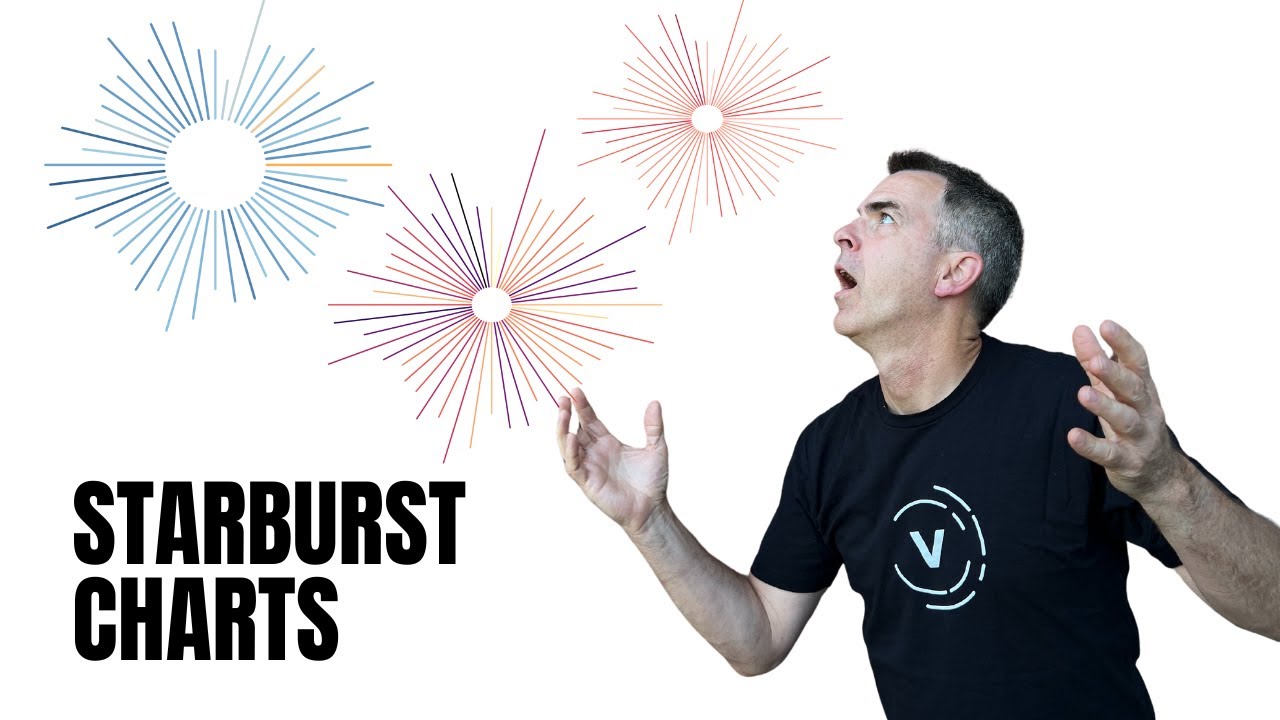
Starburst charts, sometimes called sunburst charts or circular timelines, are one method of displaying data over time. They may look cool, but they aren't exactly easy to understand. If you are going to use them, I'd advise you to check with your audience first to ensure they understand how to read them.

In this video I will walk you through:
0:00 Intro
0:40 Data prep
1:17 Create the calculations
3:12 Build the view
4:08 How to get the first date at 12 o'clock
5:06 Build the trellis view (multiple starburst charts)
7:06 Adjust the size of the center
7:22 Labeling the center of the circle

Get the workbook - https://www.vizwiz.com/2022/10/starbu...

ABOUT THIS CHANNEL
This channel is dedicated to making you great at Tableau and introducing you to careers and influential people in data.

SUBSCRIBE:
   / andykriebel  

MORE TIPS & INTERVIEWS
https://www.vizwiz.com/
https://www.dualaxispodcast.com/

FOLLOW ME ON SOCIAL
Get updates or reach out to get updates on my social media profiles!
Twitter:   / vizwizbi  
LinkedIn:   / andykriebel  
Facebook:   / vizwiz  
Spotify: https://spoti.fi/3Sw5i5D
Apple Podcasts: https://apple.co/3yj7y89
Google Podcasts: https://bit.ly/3yiz0mq
Amazon Music: https://amzn.to/3yk27Wy

CALCULATIONS
If you get any errors, double check that the letter case matches; copy/paste these calculations and you should be fine.

1. RADIAL FIELD
ABS([Sales])
// Change this to whichever measure you are using

2. ADJUSTER
Float type parameter, default to 10, but need to adjust to get the correct date at the top

3. RADIAL ANGLE
(INDEX()-[2. ADJUSTER]) * (1/WINDOW_COUNT(COUNT([1. RADIAL FIELD])))*2*PI()

4. RADIAL INNER
Float type parameter, default to 1

5. RADIAL OUTER
Float type parameter, default to 2

6. RADIAL LENGTH
[4. RADIAL INNER]+
IIF(ATTR([Table Name])='Orders1',0,
AVG([1. RADIAL FIELD])/WINDOW_MAX(AVG([1. RADIAL FIELD]))*([5. RADIAL OUTER]-[4. RADIAL INNER]))
// Change [Table Name] and 'Orders1' to match your data

7. RADIAL X
-[6. RADIAL LENGTH]*COS([3. RADIAL ANGLE])

8. RADIAL Y
[6. RADIAL LENGTH]*SIN([3. RADIAL ANGLE])

TRELLIS CHART CALCULATIONS
9. COLUMNS
(index()-1)%(round(sqrt(size())))

10. ROWS
int( (index()-1)/(round(sqrt(size()))))

#Tableau

Поделиться в:

Доступные форматы для скачивания:

Скачать видео mp4

  • Информация по загрузке:

Скачать аудио mp3

Похожие видео

How I Create a RADIAL BUBBLE CHART in Tableau

How I Create a RADIAL BUBBLE CHART in Tableau

#Tableau - 3 Level Bar Chart Drill Down

#Tableau - 3 Level Bar Chart Drill Down

How to Create a Sunburst Chart in Tableau? | Step By Step

How to Create a Sunburst Chart in Tableau? | Step By Step

How I Create a JITTERED BAR CHART in Tableau

How I Create a JITTERED BAR CHART in Tableau

Relative Filtering in Tableau| Year to Date, Month to Date ,Quarter to Date| Dynamic Comparing 2 Yr.

Relative Filtering in Tableau| Year to Date, Month to Date ,Quarter to Date| Dynamic Comparing 2 Yr.

Учебное пособие по ClickUp — Как использовать ClickUp для начинающих

Учебное пособие по ClickUp — Как использовать ClickUp для начинающих

Многослойная диаграмма Sunburst в Tableau

Многослойная диаграмма Sunburst в Tableau

How to Build Radar Plots in Tableau | (Warning! I filmed this way passed my bedtime!)

How to Build Radar Plots in Tableau | (Warning! I filmed this way passed my bedtime!)

Radial bar chart in tableau

Radial bar chart in tableau

⚡️ Трампа встретили матом || Дерзкое заявление Зеленского

⚡️ Трампа встретили матом || Дерзкое заявление Зеленского

System Design Concepts Course and Interview Prep

System Design Concepts Course and Interview Prep

ОБЫЧНЫЙ VPN УМЕР: Чем обходить блокировки в 2026

ОБЫЧНЫЙ VPN УМЕР: Чем обходить блокировки в 2026

Zen Master: The

Zen Master: The "Tableau Twins" Take You Beyond Show Me

Но что такое нейронная сеть? | Глава 1. Глубокое обучение

Но что такое нейронная сеть? | Глава 1. Глубокое обучение

#Tableau - Create a Full Year Calendar Heatmap

#Tableau - Create a Full Year Calendar Heatmap

End-to-End Tableau for Beginners

End-to-End Tableau for Beginners

How to create Funnel Chart in Tableau

How to create Funnel Chart in Tableau

How to Create an Drill Down Donut Chart [in Tableau]

How to Create an Drill Down Donut Chart [in Tableau]

Mastering 4-Level Map Drill Downs in Tableau

Mastering 4-Level Map Drill Downs in Tableau

LLM и GPT - как работают большие языковые модели? Визуальное введение в трансформеры

LLM и GPT - как работают большие языковые модели? Визуальное введение в трансформеры

© 2025 dtub. Все права защищены.


  • Контакты
  • О нас
  • Политика конфиденциальности


Контакты для правообладателей: infodtube@gmail.com