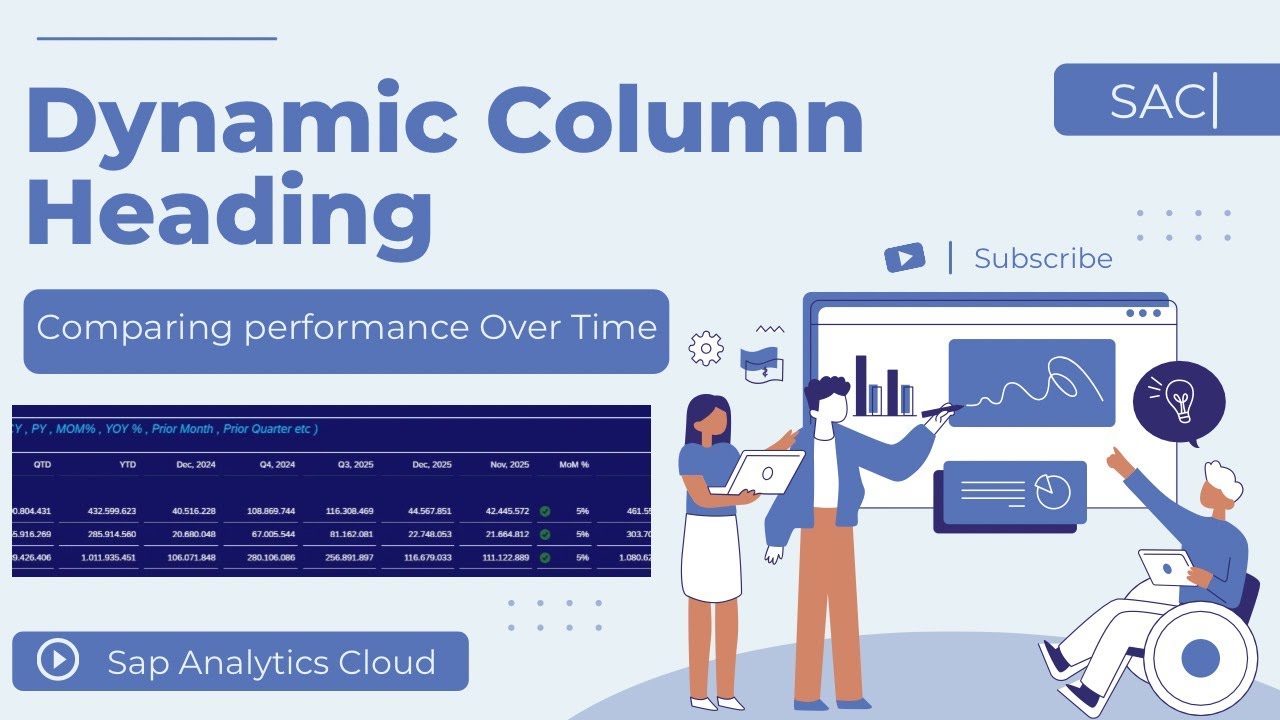
SAP Analytics Cloud (SAC) | Story Design | Dynamic Column Headers
Автор: TECHNOLOGY EXPERTS
Загружено: 2025-12-16
Просмотров: 221
Unlock the power of time-based calculations in SAP Analytics Cloud (SAC)!
In this video, we walk step-by-step through how to create MTD (Month-to-Date), QTD (Quarter-to-Date), and YTD (Year-to-Date) calculations using SAC’s modeling and formula features.
Whether you're a beginner or an experienced SAC user, this tutorial will help you understand:
✔ What MTD, QTD, and YTD mean in business reporting
✔ How to set up time dimensions properly
✔ How to create dynamic time-based calculations
✔ Best practices for designing financial and operational dashboards
✔ Common mistakes and how to avoid them
This session is perfect for Financial Analysts, FP&A teams, BI Developers, Consultants, or anyone looking to enhance their SAC reporting skills.
🔧 Topics Covered
Introduction to Time Intelligence in SAP Analytics Cloud
Creating MTD, QTD, and YTD measures
Using Calculated Measures & Restricted Measures
Practical examples in a live SAC model
Tips for optimizing reporting performance
💡 Why These Calculations Matter
MTD, QTD, and YTD metrics help organizations track performance over time, compare results with historical periods, and make more informed business decisions. With SAC’s powerful modeling tools, you can build dynamic and automated reports with ease.
Fiscal Year Jan to Dec 2025
MTD : ( Month till Date )
1 Dec 2025 to Today
QTD : ( Quarter till Date )
1 Oct 2025 to Today
YTD : ( Year till Date )
1 Jan 2025 to Today
Prev Month : Nov 2025
Curr Month : Dec 2025
Prev Quarter : Q3 2025
1 July to 30 Sep 2025
Last Year : 2024
Last Year quarter : Q4 2024
1 Oct to 31 Dec 2024
Last Year Month : Dec 2024
📥 Don’t forget to Like, Share & Subscribe
If you found this tutorial helpful, support the channel for more SAC, SAP HANA, and BI content.
Доступные форматы для скачивания:
Скачать видео mp4
-
Информация по загрузке: