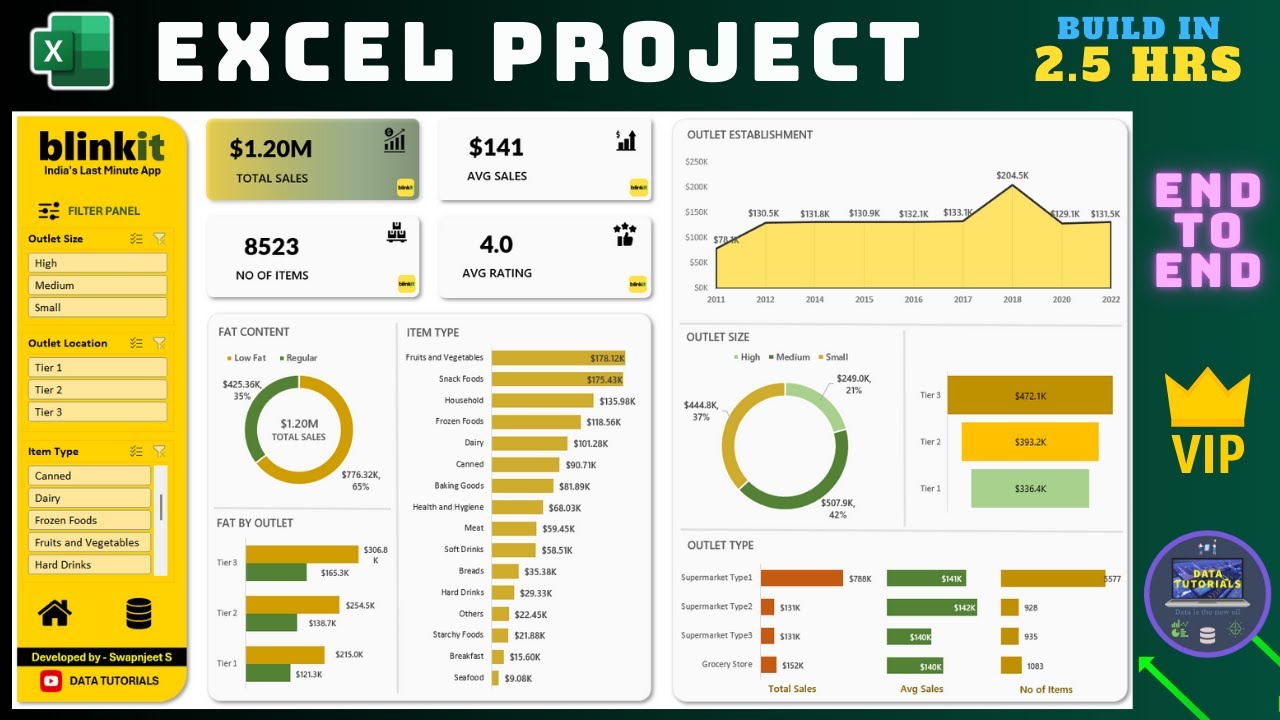
Interactive Excel Project | Real time Blinkit Analysis | Start to End | For Beginners | Excel 2024
Автор: Data Tutorials
Загружено: 2024-10-14
Просмотров: 143617
Build a Excel Project from Start to End using real time data. Blinkit Analysis from start to end in this complete video.
#excel #dataanalytics #datascience
In this Excel video you will learn requirement gathering, data cleaning, processing, analysis and dashboard creation in Excel. Complete data analytics project for data analyst in Excel.
📱Data Analysis Material and Projects - https://topmate.io/data_tutorials
📱1:1 Career Guidance - https://topmate.io/data_tutorials
📱Follow me on Facebook - https://www.facebook.com/profile.php?...
📱 Follow me on LinkedIn - / swapnjeet-s-58a673273
Data Download - https://drive.google.com/drive/folder...
This video is specially made for beginners, intermediates, freshers, college students and recent pass outs. It will help in learning new skill. This video will help in getting a good hold on tools like Excel. By practicing this tool and developing similar dashboards one can even start with freelancing on international platforms.
Developing similar end to end deploy ready projects will help freshers/ beginners understanding the work flow of a project.
⭐Data Analyst Material available at very minimal cost of Rs. 999. This will include a complete Data Analyst Syllabus with video links, important pdf's, Q&A, this will also include Complete project on Excel (2 Projects), Tableau (2 Projects) and Power BI (1 Project). And the projects will be different from that uploaded on You Tube. If you are interested to buy contact me on my mail or WhatsApp.
For More info watch this Data Analyst Roadmap 2.0 video - • Data Analyst Roadmap 2.0 | 2023 - 2024 | H...
Details mentioned below-
email- swapnjeet555@gmail.com
WhatsApp - +91 9579005495
#exceltutorial #dataanalytics #dataanalystproject
⭐For Tableau, Power BI and Excel Projects contact me on my mail id or WhatsApp number mentioned at the end of description box.
Steps Covered-
1. Requirement gathering from client
2. Identify the Stakeholders of the Project
3. Data cleaning as per the requirement
4. Data Processing by adding some customized columns in data
5. Data Analysis by Pivot Tables and Excel Functions
6. Data Visualization to create charts and custom sheets to show the insights
7. Report/ Dashboard creation from start to end
➖➖➖➖➖➖➖➖➖➖➖➖➖
Checkout my other videos on dashboards design in Tableau, Power BI and Excel below-
✅Data Modelling - • Data Modeling in Power BI | Power BI Tutor...
✅Data Cleaning - • Data Cleaning in Power BI | Power Query | ...
✅Data Analyst Portfolio Projects - • SQL & Excel Portfolio Project | Data Analy...
✅Power BI Projects - • Power BI Dashboard from Start to End (Part...
✅Tableau Projects - • Tableau Dashboard from Start to End (Part ...
✅Excel Projects - • Dynamic Excel Dashboard from Start to End ...
✅SQL Projects - • Data Analysis SQL Project | Complete SQL p...
✅Power BI Interview Questions with Answers - • Power BI Scenario based interview question...
✅Tableau Interview Questions with Answers - • Tableau Scenario Based Interview Questions...
=
➖➖➖➖➖➖➖➖➖➖➖➖➖
Reach out to me for any personal or Business related Dashboard/ Report development on my email- swapnjeet555@gmail.com
WhatsApp - +91 9579005495
Доступные форматы для скачивания:
Скачать видео mp4
-
Информация по загрузке:


