📊 COVID-19 Cases Worldwide (2019–2023) | Global Timeline Visualization
Автор: Dataworld
Загружено: 2025-12-11
Просмотров: 64
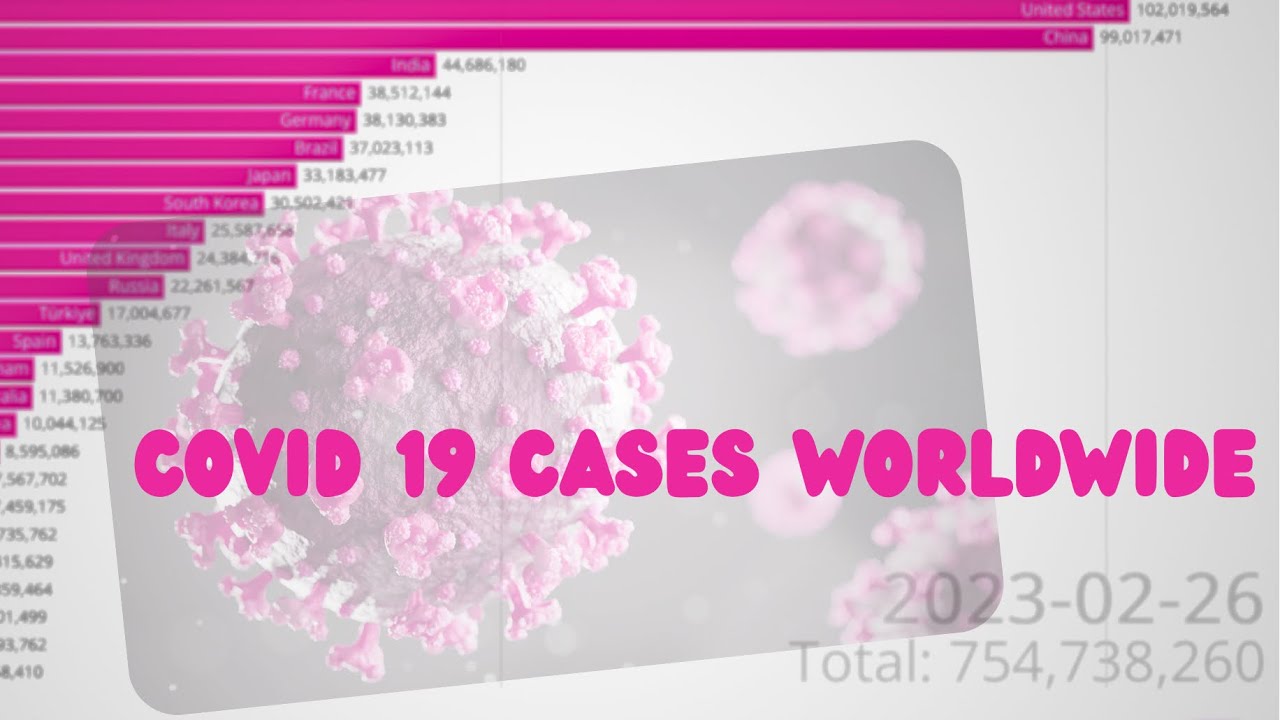
This video shows the rise of COVID-19 cases around the world from 2019 to 2023. Watch as countries shift in ranking over time, from the early spread of the virus to major global surges. Using real data, this visualization highlights how quickly the pandemic expanded and which nations were most affected.
🌍 Data Range: 2019–2023
📅 Final Date Shown: February 26, 2023
🔢 Total Global Cases: 754,738,260+
Whether you’re studying the pandemic, researching global health trends, or just curious how the numbers changed over time, this video provides a clear and engaging overview of one of the most impactful events in recent history.
If you found this helpful, don’t forget to like, comment, and subscribe for more data visualizations and timeline videos.
#geography #barchartrace #coutryballs #datavisualization #covid19 #coronavirus
Доступные форматы для скачивания:
Скачать видео mp4
-
Информация по загрузке:


