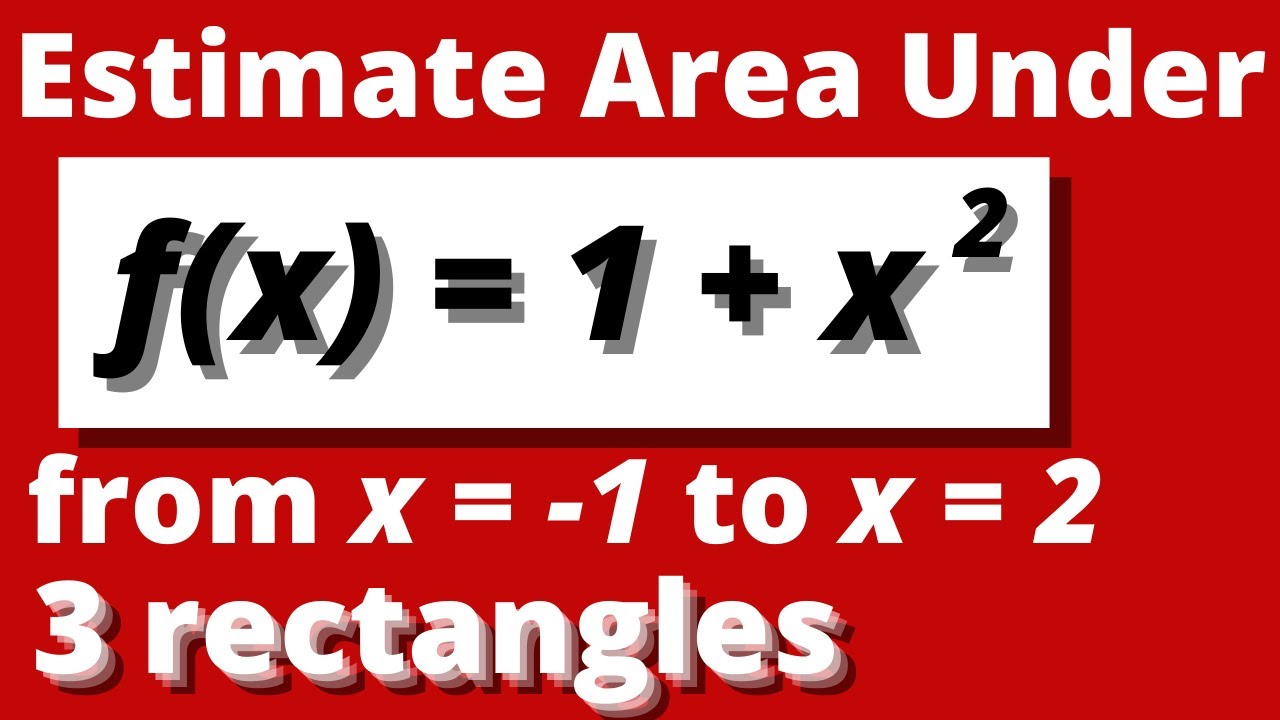
MIDPOINT RULE | Estimate the area under the graph f(x)=1+x^2 from x=-1 to x=2 with three rectangles
Автор: Jake's Math Lessons
Загружено: 2020-12-17
Просмотров: 6468
Estimate the area under the graph of f(x)=1+x^2 from x=-1 to x=2 using three approximating rectangles and midpoints. In this video I'll show you how to estimate the area under the graph using three approximating rectangles and midpoints. Of course, this same technique can be applied for any number of estimating rectangles. And the process for right endpoints and left endpoints is similar too. I'll show you how to estimate the area under this curve with the midpoint formula, also known as the midpoint Riemann sum equation.
RECOMMENDED READING
The Calculus Lifesaver by Adrian Banner - https://amzn.to/345xB4d
0:00 Intro - Estimate the area under the graph
0:33 Midpoint Riemann sum equation
1:25 Determine pieces of the midpoint formula
3:34 Plug i values into the midpoint formula sum
5:27 Add up all terms representing rectangle areas
WATCH NEXT
Left Endpoint Rule - • LEFT ENDPOINT RULE | Estimate the area und...
Right Endpoint Rule - • RIGHT ENDPOINT RULE | Estimate the area un...
All Things Integrals (My Calculus 2 Study Guide Playlist) - • ALL THINGS INTEGRALS - My Calculus 2 Study...
The Calculus Lifesaver by Adrian Banner - • THE CALCULUS LIFESAVER BY ADRIAN BANNER RE...
YOU MIGHT ALSO BE INTERESTED IN...
Get my calculus 2 study guide - https://jakesmathlessons.com/calculus...
Work with me! - Come to Wyzant for some 1-on-1 online tutoring with me and get a $40 tutoring credit for FREE - https://is.gd/cqeuOv
Some links in this video description may be affiliate links meaning I would get a small commission for your purchase at no additional cost to you.
Доступные форматы для скачивания:
Скачать видео mp4
-
Информация по загрузке: