Популярное

Музыка Кино и Анимация Автомобили Животные Спорт Путешествия Игры Юмор

Интересные видео

2025 Сериалы Трейлеры Новости Как сделать Видеоуроки Diy своими руками

Топ запросов

смотреть а4 schoolboy runaway турецкий сериал смотреть мультфильмы эдисон
dTub
Скачать

Moody Chart Summary

Автор: David Lampert

Загружено: 2025-04-05

Просмотров: 598

Описание:

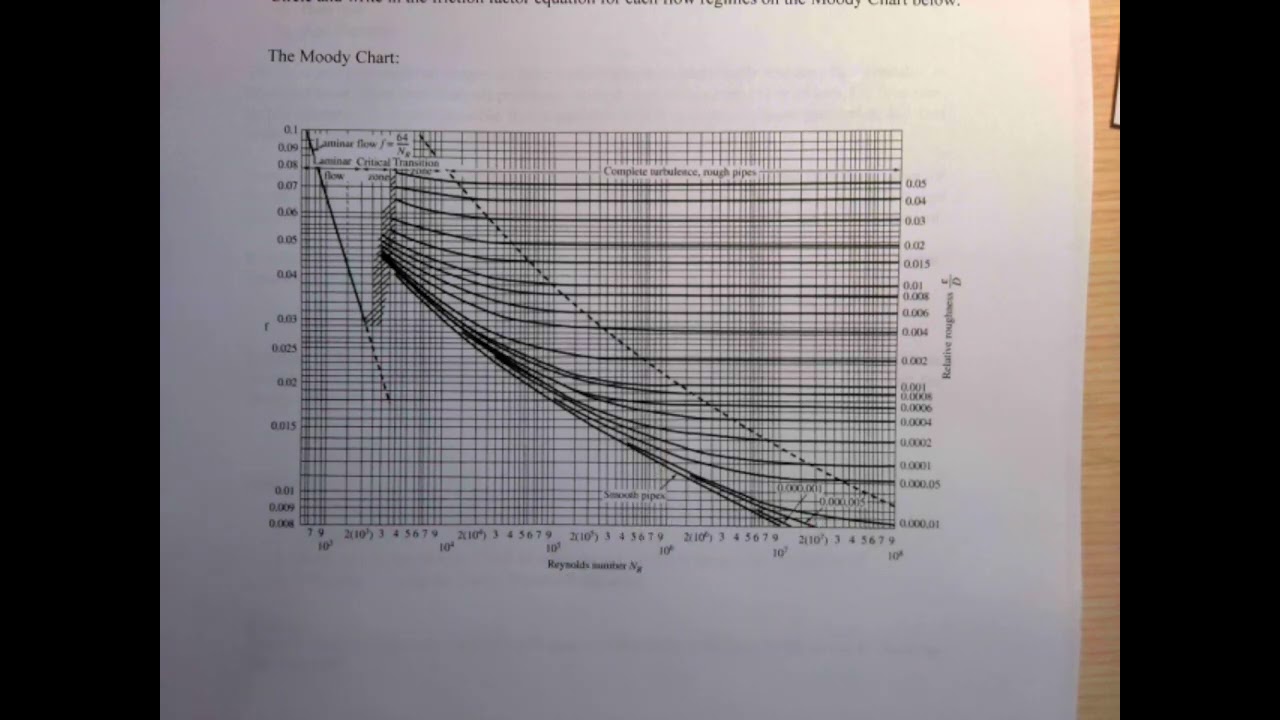
This video summarizes the theory underlying the Moody Chart that is used to estimate the friction factor for pipe head loss calculations. There are four flow regimes represented by the Moody Chart: laminar, turbulent in a smooth pipe, turbulent in a rough pipe, and turbulent transition. The chart shows the dimensionless friction factor in the Darcy-Weisbach Equation as a function of the dimensionless relative roughness and dimensionless Reynolds number.

Moody Chart Summary

Поделиться в:

Доступные форматы для скачивания:

Скачать видео mp4

  • Информация по загрузке:

Скачать аудио mp3

Похожие видео

Head loss due to friction in a pipe using Moody Diagram and the Darcy–Weisbach equation

Head loss due to friction in a pipe using Moody Diagram and the Darcy–Weisbach equation

Minor Losses Example Problems - with Major Losses and Moody Diagram

Minor Losses Example Problems - with Major Losses and Moody Diagram

Welcome to R exercise part 3

Welcome to R exercise part 3

Moody chart and how to use it? (with Animation Fluid Mechanics)

Moody chart and how to use it? (with Animation Fluid Mechanics)

How to read the Moody Diagram

How to read the Moody Diagram

Лучшее объяснение частных производных и градиентов

Лучшее объяснение частных производных и градиентов

Estimating Air Flow in a Duct using the Fan Curve

Estimating Air Flow in a Duct using the Fan Curve

Fluid Mechanics 11.5 - Friction Factor - Moodys Chart or Diagram - Colebrook and Haaland Formula

Fluid Mechanics 11.5 - Friction Factor - Moodys Chart or Diagram - Colebrook and Haaland Formula

Why Does Fluid Pressure Decrease and Velocity Increase in a Tapering Pipe?

Why Does Fluid Pressure Decrease and Velocity Increase in a Tapering Pipe?

Все, что вам нужно знать о теории управления

Все, что вам нужно знать о теории управления

Задача про надёжный пароль | В интернете опять кто-то неправ #035 | Борис Трушин и Математик Андрей

Задача про надёжный пароль | В интернете опять кто-то неправ #035 | Борис Трушин и Математик Андрей

Computing flow rate in a pipe with turbulent flow

Computing flow rate in a pipe with turbulent flow

Physics 34.1  Bernoulli's Equation & Flow in Pipes (6 of 38) The Moody Diagram

Physics 34.1 Bernoulli's Equation & Flow in Pipes (6 of 38) The Moody Diagram

Что такое СПИН? спин 1/2 и 3/2

Что такое СПИН? спин 1/2 и 3/2

Преломление и «замедление» света | По мотивам лекции Ричарда Фейнмана

Преломление и «замедление» света | По мотивам лекции Ричарда Фейнмана

Самый короткий тест на интеллект Задача Массачусетского профессора

Самый короткий тест на интеллект Задача Массачусетского профессора

Парадокс разгибания кривой доски

Парадокс разгибания кривой доски

Fluid Mechanics: Laminar & Turbulent Pipe Flow, The Moody Diagram (17 of 34)

Fluid Mechanics: Laminar & Turbulent Pipe Flow, The Moody Diagram (17 of 34)

Using a Moody Chart

Using a Moody Chart

Fluid Mechanics: Topic 8.6.2 - The Moody chart

Fluid Mechanics: Topic 8.6.2 - The Moody chart

© 2025 dtub. Все права защищены.


  • Контакты
  • О нас
  • Политика конфиденциальности


Контакты для правообладателей: infodtube@gmail.com