Netflix Analysis and Visualization using D3.js
Автор: Sarah Bazlamit
Загружено: 2025-12-12
Просмотров: 14
In this video, I present an interactive data visualization project built using D3.js and JavaScript.
The project is based on a Netflix titles dataset sourced from Kaggle. Before creating the visualizations, I performed data cleaning, preparation, and testing to ensure the accuracy of the results.
The project is presented as a small website with two pages:
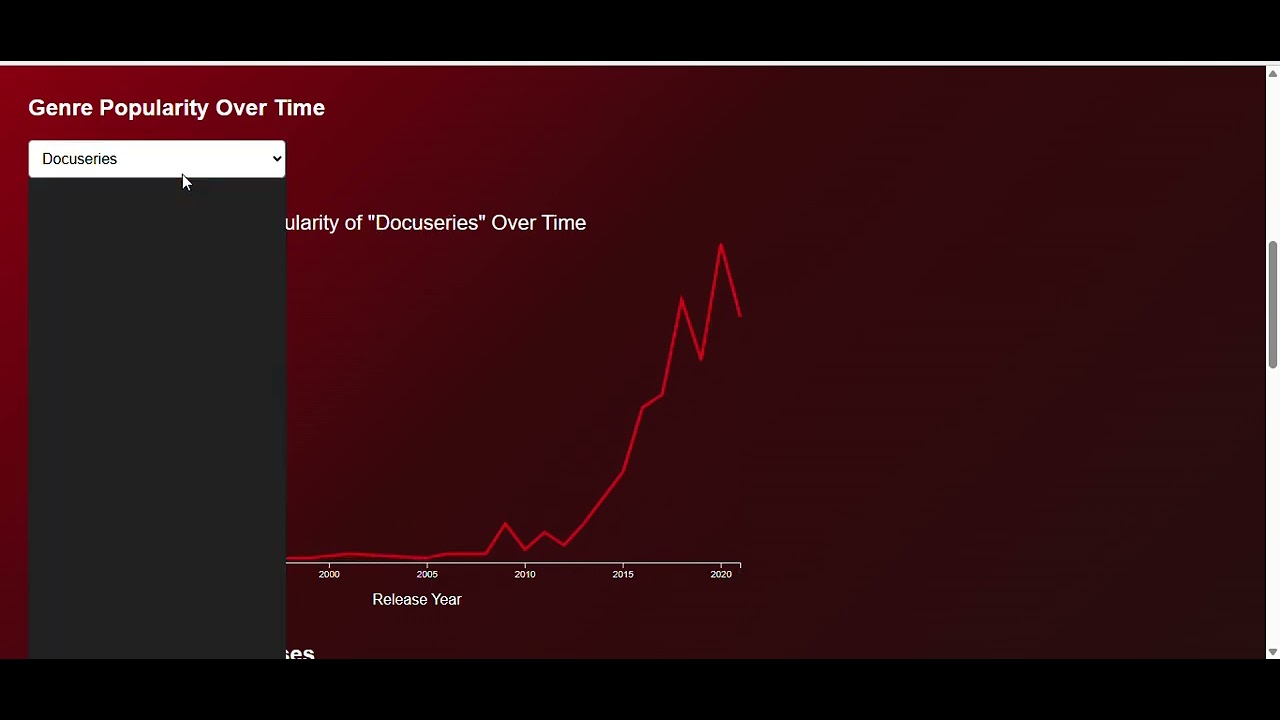
A visualization page containing interactive D3 charts
A documentation page explaining the data processing and design decisions
In the video, I focus on walking through the visualizations and highlighting the key insights and results, including:
A comparison of Movies vs TV Shows on Netflix
Genre popularity trends over time
Top countries producing Netflix content by year
Distribution of Netflix content maturity ratings
Each visualization includes interactive features such as buttons, dropdown menus, tooltips, sorting, and legends to support exploration and interpretation of the data.
Tools & Technologies:
D3.js
JavaScript
HTML & CSS
Netflix Dataset (Kaggle)
Доступные форматы для скачивания:
Скачать видео mp4
-
Информация по загрузке:


![♪ ENZZI - BANANA ROLLO YEAH ♪ [OFICJALNY TELEDYSK]](https://image.4k-video.ru/id-video/dnyDZrwWd4U)