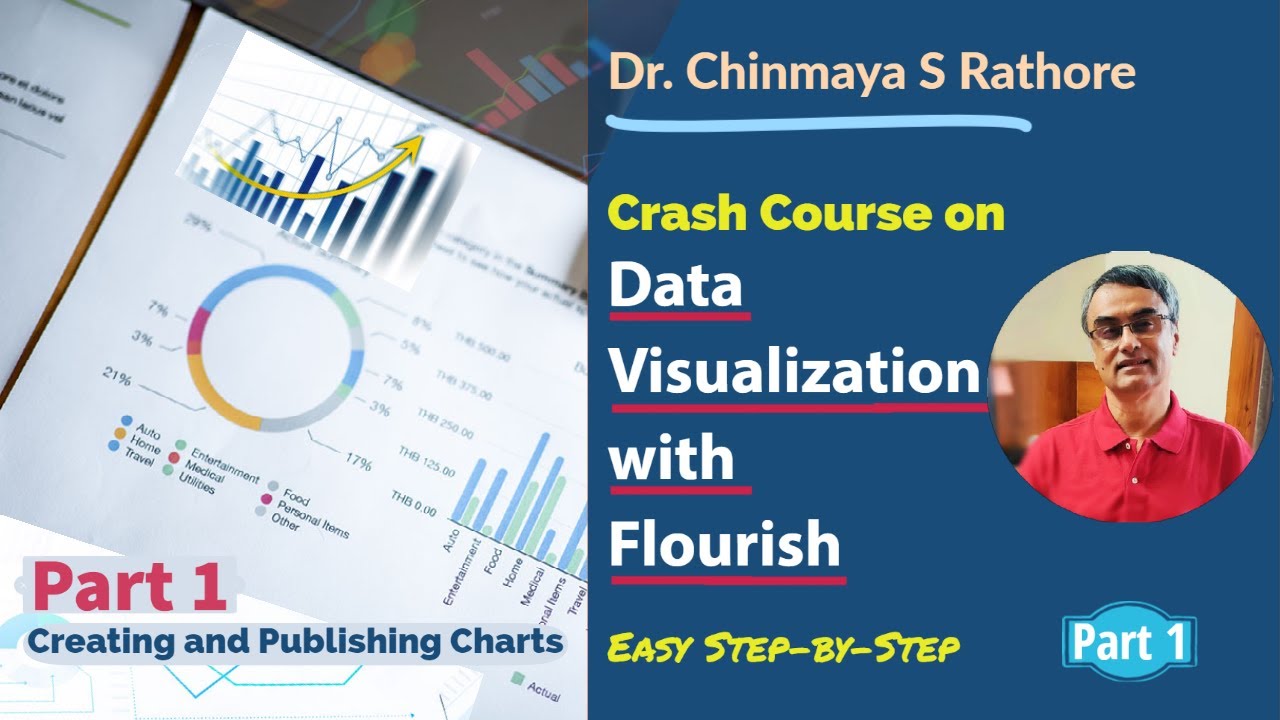
Data Visualization Using Flourish - Part 2 - Special Visualizations and Stories
Автор: Dr. Chinmaya S Rathore Tutorial Videos
Загружено: 2022-12-21
Просмотров: 939
Two Part Crash Course
Data Visualization Using Flourish - Part 2
Flourish is a great online charting tool for creating stunning charts, data visualizations and interactive stories based on data. Flourish provides numerous templates permitting you to visualize your data in many different and unique ways. One of the greatest strengths of Flourish is that charts are not only interactive and animated but are also visually striking. Charts created in flourish help bring out insights and intresting interpretations that might be missed in conventional charts created using other tools. Flourish is very intutive to work with and once you understand the user interface and basic operations, you can easily create stunning charts using your own data within a few minutes. Flourish also permits you to publish your charts online and provides you with a link to share your charts. This 2 part crash course will help you quickly get started on flourish and give you the skills to explore numerous chart templates that flourish provides.
In Part 2 of this two part tutorial series, I share some more intresting data visualization scenarios like Sankey diagrams, Survey Result Visualization, Photo Sliders and Map Stories.
Time Codes
0:00 Introduction
0:53 Lesson 7 - Visualizing Survey Data
9:58 Lesson 8 - Creating Sankey Charts
15:45 -Altering the Animation Speed
17:04 Lesson 9 - Creating a Photo Slider
22:37 Lesson 10 - Creating a Story from a Visualization
27:01 Lesson 11 - Creating a Map Story
Flourish Part 1 Tutorial
• Data Visualization Using Flourish - Part 1...
Links to follow
Flourish Website
https://flourish.studio/
Flourish Sample Datasets for Practice
https://flourish.studio/resources/dat...
Our World in Data
https://ourworldindata.org/energy-key...
Statistical Review of World Energy - BP
https://www.bp.com/en/global/corporat...
LibreOffice Tutorial Videos by Professor Chinmaya S Rathore
Animated GIFs Tutorial
• Creating and Editing Animated GIFs with Sc...
LibreOffice Writer Playlist
• LibreOffice Writer 7
LibreOffice Impress Playlist
• LibreOffice Impress 7
LibreOffice Calc Playlist
• LibreOffice Calc 7.4
#flourish #datavisualization

Доступные форматы для скачивания:
Скачать видео mp4
-
Информация по загрузке: