Скачать
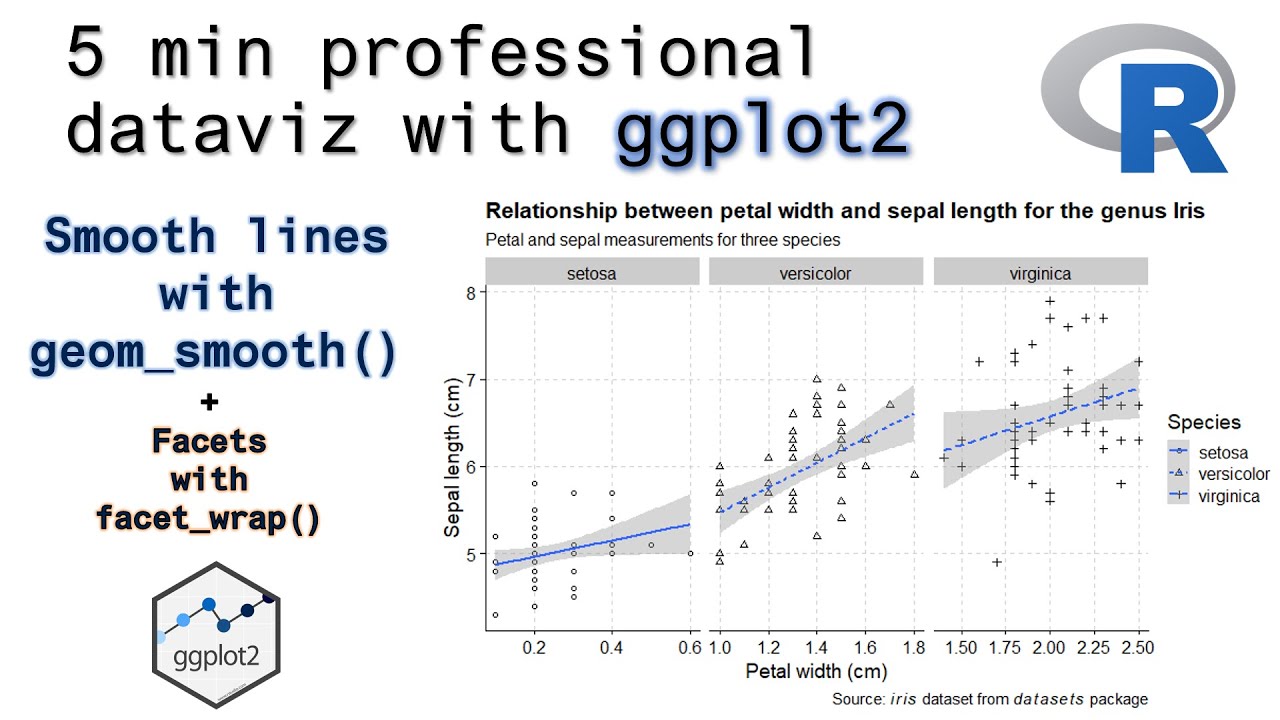
Smooth lines with geom_smooth() + Facets with facet_wrap() | Professional dataviz with ggplot2 | R
Автор: Sérgio Costa
Загружено: 2020-06-15
Просмотров: 7010
Описание:
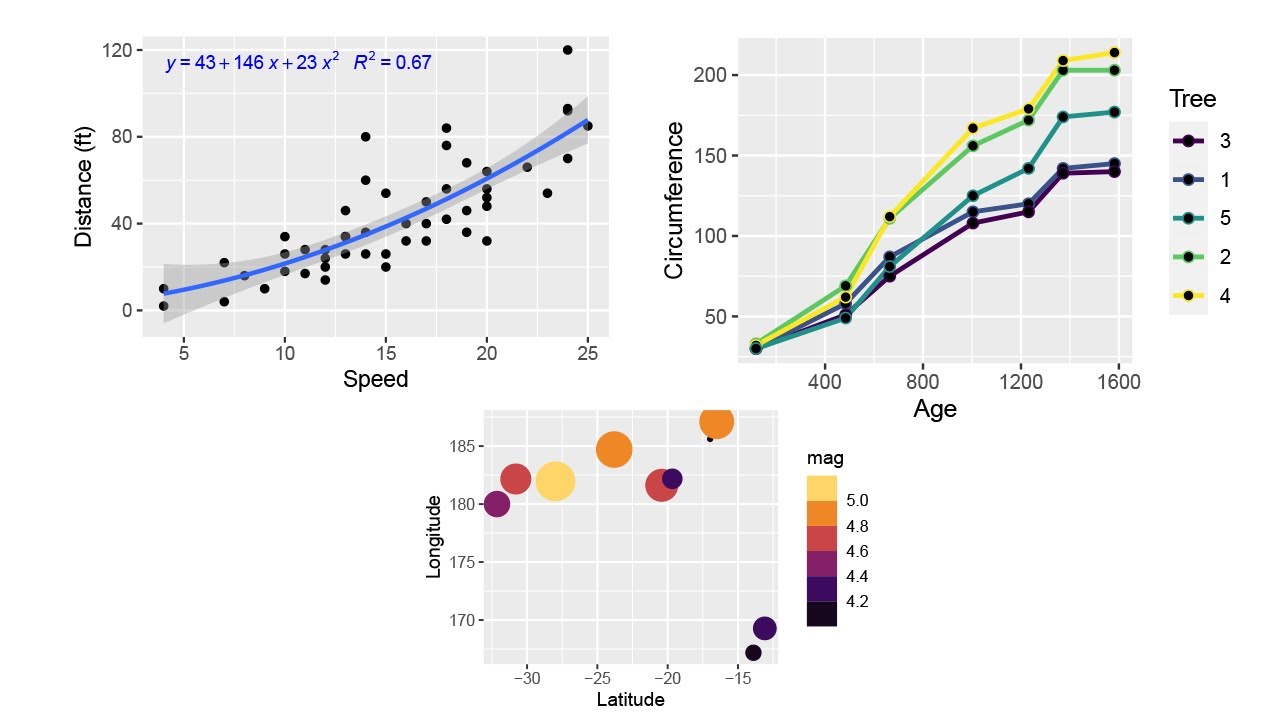
5 minutes is enough to create a professional-looking and ready for publication chart. In this video i show how to add smoothing lines and the use of facet_wrap functions from ggplot2 package.
The code and files can be found on my github repository: https://github.com/sergiocostafh/ggpl...
Forest sciences and biometrics in R (portuguese): https://mensura-r.netlify.app/
Video music: Kazukii - Dawn ( • Kazukii - Dawn )
Доступные форматы для скачивания:
Скачать видео mp4
-
Информация по загрузке: