How To Create Diverging Bar Chart in Tableau
Автор: Darpan Bajaj
Загружено: 2024-09-28
Просмотров: 653
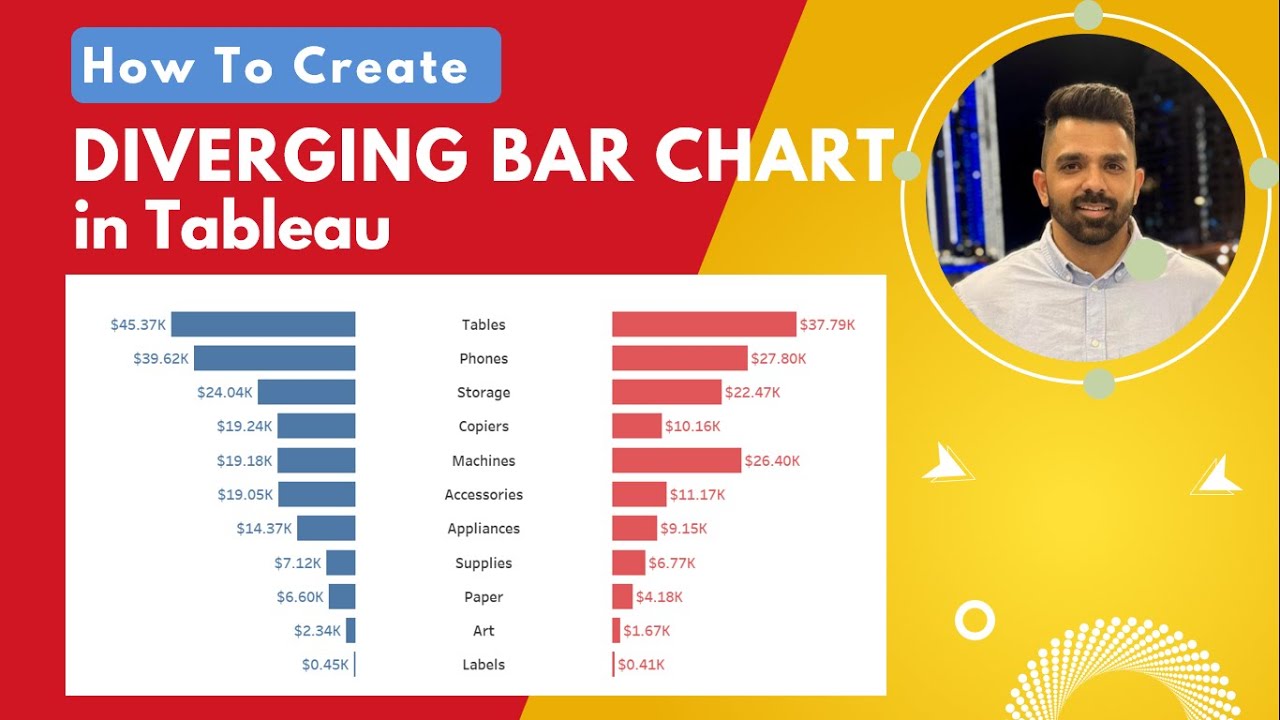
This tutorial will guide how to create diverging bar chart in Tableau to compare selected year sales with the previous year sales. It is also known as butterfly chart.
======DOWNLOAD TABLEAU WORKBOOK========
https://public.tableau.com/app/profil...
=========================================
======= 📚 WATCH MORE VIDEOS 📚 =======
💻 MICROSOFT POWER BI HELPFUL TIPS
• Microsoft Power BI Helpful Tips
💻 MICROSOFT POWER BI FOR BEGINNERS
• Microsoft Power BI For Beginners
💻 TABLEAU HELPFUL TIPS
• Tableau Helpful Tips
💻 TABLEAU FOR BEGINNERS
• Tableau For Beginners
💻 TEXT DATA PREPROCESSING IN PYTHON
• Text Data Preprocessing In Python
💻 PYTHON FOR DATA SCIENCE
• Python For Data Science
=========================================
Please like, share, and subscribe to the channel. Thank you to every single person who has already subscribed to the channel.
Keep supporting the channel 🤝 🙏 👨🎓
Доступные форматы для скачивания:
Скачать видео mp4
-
Информация по загрузке:


