Drawing of Dot Diagram Rice Production of
Автор: Sahaj Bhugol
Загружено: 2025-12-20
Просмотров: 22
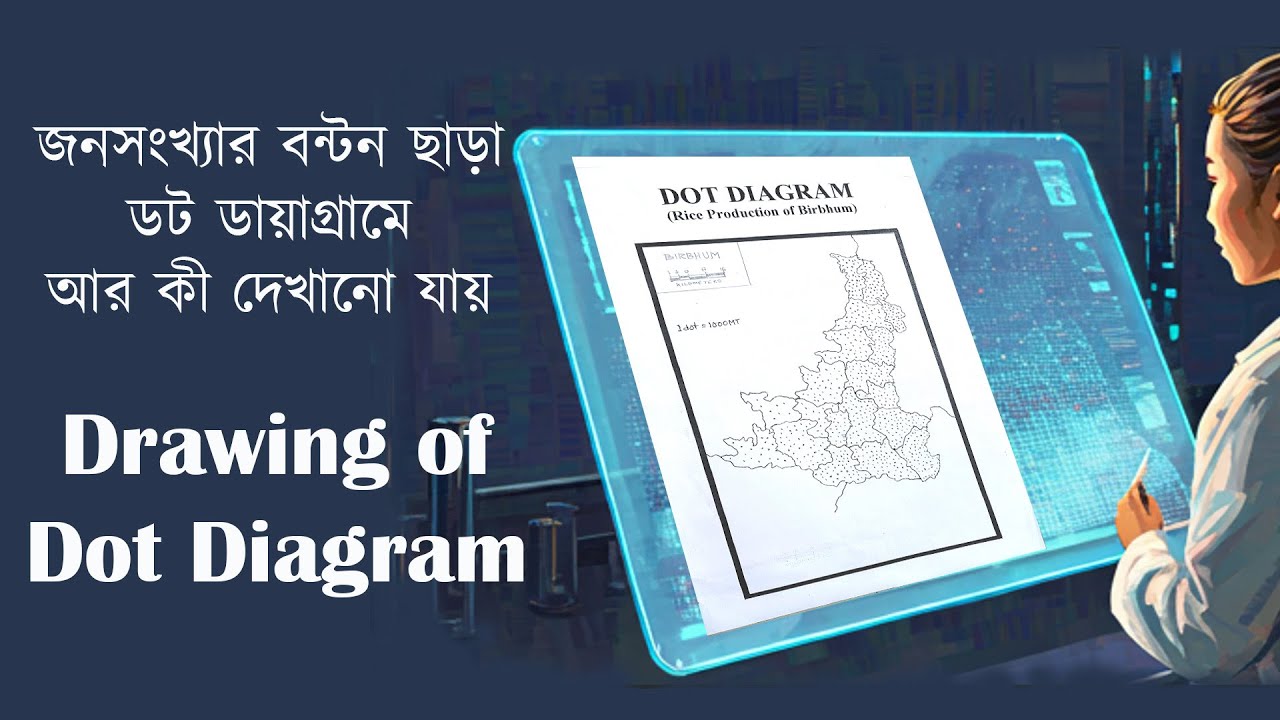
ভিডিওতে ডট ডায়াগ্রাম অঙ্কণ পদ্ধতি বোঝানো ও দেখানো হয়েছে। বেশিরভাগ ক্ষেত্রেই ডট ডায়াগ্রামে জনসংখ্যার বন্টন দেখানো হয়। কিন্তু এই ভিডিওতে শস্য উত্পাদন বন্টন দেখানো হয়েছে। শস্য উত্পাদন অঙ্কল হিসাবে বীরভূম জেলাকে বেছে নেওয়া হয়েছে। বীরভূম জেলার ব্লক ভিত্তিক ধান উত্পাদন বন্টন কেমন তা তোমরা এই ভিডিওতে দেখতে পাবে।
Drawing of Dot Diagram Rice Production of#birbhum ডিস্ট্রিক্ট,
I hope the students of class 9 class 10 class 11 class 12 BA BSc geography and MA MSc Geography may be helped from this video.
--------------
Other Video-
• VC এর সূত্রটির প্রতিষ্ঠা | Vernier স্কেল ক...
• Vernier Caliper/Slide Caliper: Measure Dia...
• যন্ত্রপাতির সাহায্যে Polar Zenithal Stereo...
• Polar Zenithal Stereographic Projection অক...
----------
#dotmap #geographypractical #class11 #class12 #geographystudy #geographystudent
Доступные форматы для скачивания:
Скачать видео mp4
-
Информация по загрузке: