55. The Secret to Dynamic Excel Reports: Timeline Filters in Pivot Tables 🔥
Автор: Analytics Advisors
Загружено: 2025-10-31
Просмотров: 29010
My Microsoft Excel Playlist: • Zero to Hero in Microsoft Excel: Complete ...
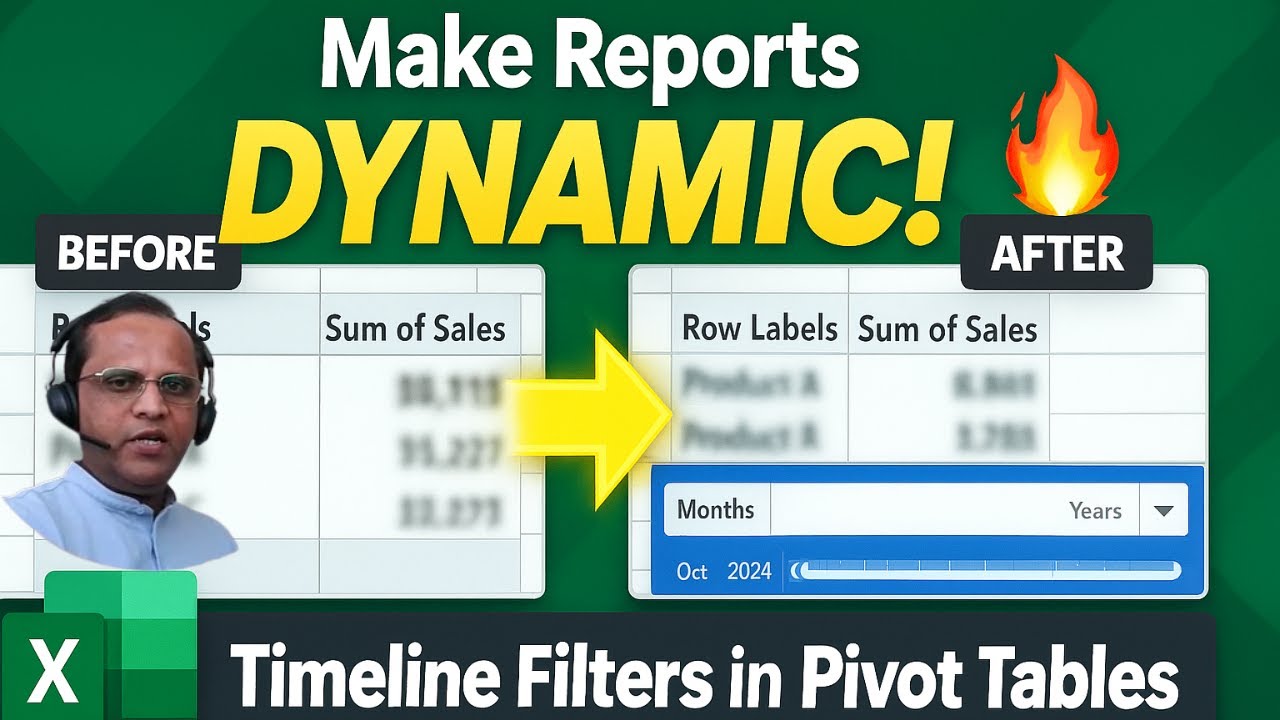
⏰ Want to make your Excel reports interactive and dynamic? In this video, I’ll reveal the secret to using Timeline Filters in Pivot Tables — one of Excel’s most powerful but often overlooked features!
You’ll learn how to add, format, and use Timelines to instantly filter your data by date, month, quarter, or year — perfect for dashboards and data analysis.
📊 In this video, you’ll learn:
✅ What a Timeline is and how it works in Pivot Tables
✅ How to insert a Timeline in Excel step-by-step
✅ How to connect a Timeline to multiple Pivot Tables
✅ How to customize Timeline design & layout
✅ Real-world examples for business dashboards
🚀 By the end, you’ll know how to turn your Pivot Tables into interactive reports that update instantly — no formulas, no VBA, just smart Excel skills!
📁 Chapters:
00:00 – Introduction
00:21 – What Are Timelines in Pivot Tables?
00:48 – Adding a Timeline in Excel
01:46 – Playing with a Timeline in Pivot Table
03:08 – Customizing Timeline Design & Style
05:05 – Details of next video in series
👍 Like this video if you love learning new Excel tricks!
💬 Comment your favorite Excel feature below — I might cover it next!
🔔 Subscribe for weekly tutorials on Excel, Pivot Tables, and Data Dashboards
#ExcelTutorial #PivotTable #ExcelTips #MicrosoftExcel #ExcelTricks #DataAnalysis #LearnExcel #ExcelDashboard #ExcelTraining #Excel2025
__________________________________________________________________________
Welcome to Analytics Advisors – your comprehensive learning hub for mastering data analytics, data visualization, and business intelligence tools. Whether you're a student, aspiring analyst, or seasoned data professional, our channel is dedicated to helping you build the skills needed to thrive in the data-driven world.
At Analytics Advisors, we provide in-depth tutorials, practical walkthroughs, and real-world examples focused on some of the most powerful and in-demand tools in the industry:
Power BI, Tableau, Microsoft Excel, MicroStrategy, Google Looker Studio (formerly Data Studio), and SQL.
Our mission is to make data skills accessible, practical, and results-oriented. You'll learn how to:
1) Build interactive dashboards with Power BI, Tableau, and Looker Studio
2) Write optimized SQL queries for data analysis and reporting
3) Use advanced Excel formulas and pivot tables for dynamic dashboards
4) Model data and write DAX expressions in Power BI
5) Compare and integrate different BI tools effectively
6) Automate reports and streamline analytics workflows
7) Create compelling visualizations and tell meaningful data stories
We also dive into topics like data modeling, performance tuning, tool comparisons (e.g., Power BI vs Tableau), and step-by-step projects to build your analytics portfolio. Whether you're working with business data, marketing metrics, sales reports, or custom data sets, our tutorials are tailored to teach you real-world applications—not just theory.
Our channel is perfect for:
Aspiring data analysts
Business intelligence professionals
Excel power users
Data enthusiasts
Career changers entering the analytics field
Managers and business users who want to make data-driven decisions
By subscribing to Analytics Advisors, you gain access to consistently updated, high-quality content that keeps you ahead in the fast-evolving world of analytics. Our content is beginner-friendly yet deep enough for advanced learners looking to refine their skills and stay competitive.
We believe that anyone can learn how to analyze, visualize, and communicate data effectively—with the right guidance. Our videos are structured to be clear, concise, and actionable, so you can start applying what you learn immediately.
📌 Don’t forget to subscribe and click the notification bell so you never miss a new video.
Let Analytics Advisors be your trusted companion on the journey to becoming a confident, skilled, and impactful data professional.
Your path to data mastery starts here.
Доступные форматы для скачивания:
Скачать видео mp4
-
Информация по загрузке: