Скачать
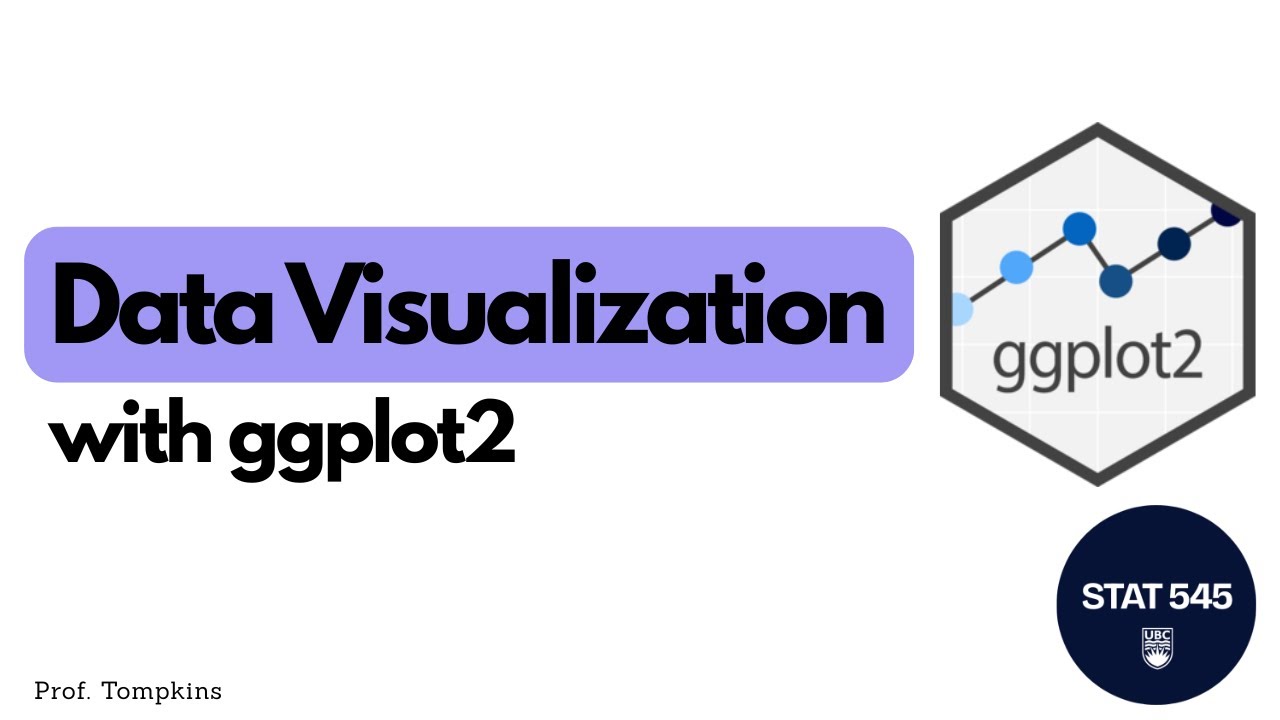
Effective Data Visualization with ggplot2 in R
Автор: Grace Tompkins, PhD
Загружено: 2025-09-18
Просмотров: 184
Описание:
In this video, we talk about the basics of effective data visualization and go through an example of creating a scatterplot using the mtcars dataset in R
0:00 - Effective Data Visualization
2:28 - Packages
3:07 - mtcars Data Set
4:19 - Initializing the ggplot
5:24 - Piping data into ggplots
6:10 - Basic Scatterplot
7:08 - Grouping by Colour
9:40 - Colourblind Friendly Plots
10:19 - Grouping by Shape
10:59 - Axis Labels
11:24 - Legend Labels
12:11 - Adding a Title
12:48 - Changing the Theme
13:78 - Summary
Доступные форматы для скачивания:
Скачать видео mp4
-
Информация по загрузке: