Популярное

Музыка Кино и Анимация Автомобили Животные Спорт Путешествия Игры Юмор

Интересные видео

2025 Сериалы Трейлеры Новости Как сделать Видеоуроки Diy своими руками

Топ запросов

смотреть а4 schoolboy runaway турецкий сериал смотреть мультфильмы эдисон
dTub
Скачать

Uniform Distribution Explained with Examples

Автор: Lucas Learns

Загружено: 2024-03-26

Просмотров: 6665

Описание:

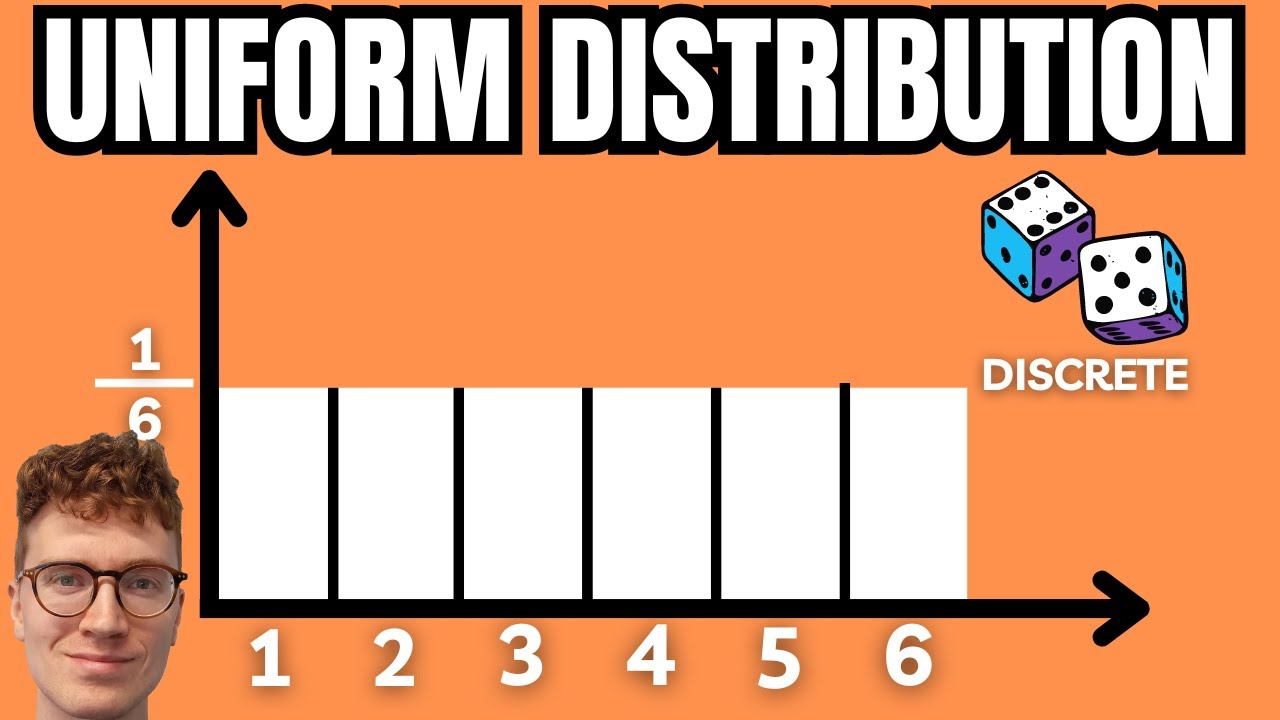
A uniform distribution describes a situation where each event is EQUALLY LIKELY to occur. Therefore, graphs of uniform distributions always have a rectangular shape because the likelihood of every event is the same.

Rolling a dice is an example of a DISCRETE uniform distribution as each side of the dice is equally likely to show up. An example of a CONTINUOUS uniform distribution could be what time the next bus arrives when you know it arrives every hour but you don’t know when the last one left.

Let’s imagine this bus example and ask ourselves 4 questions:

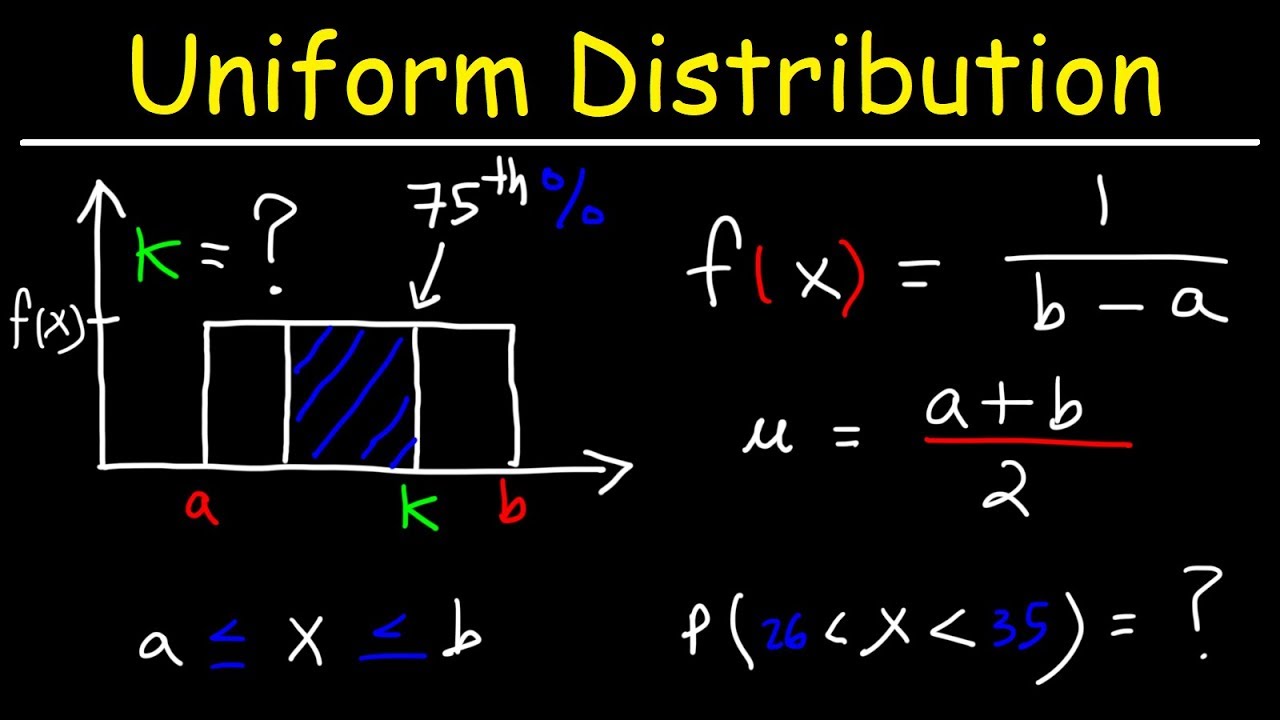
1. What is the PROBABILITY DENSITY FUNCTION for this situation?
2. How do we draw a continuous distribution graph for this situation?
3. What is the likelihood of us having to wait between 5 and 20 minutes for the bus?
4. What is the mean and standard deviation for this situation?

The formula for the probability density function is written as f(x) = 1 / (b-a). In this formula 1 is the total probability of ALL POSSIBLE outcomes, i.e 100% or 1, b is the upper bound or the maximum amount of time we must wait and a is the lower bound, the minimum amount of time we must wait for the bus. This means that the probability density function can be written as 1 / (60-0).

To graph this we simply mark where points a and b are on the x-axis and the point where the probability density function is on the y-axis. Then we draw a rectangle including all 3 points. In other words, this rectangle will include all possible events and their probabilities.

To find the likelihood of us having to wait between 5 and 20 minutes for the bus, we’ll simply draw a smaller rectangle in the same way. So in this case a = 5, b = 20. and the probability density function is still the same. Then, we simply calculate the area of this new rectangle. So the BASE = 20-5 which is 15 times the height of the rectangle which is still 1/60. So 15 divided by 60 = 0.25 or 25%.

Finally, the formulae for the mean and standard deviation are mean = (a+b) / 2 and standard deviation = (b-a) / square root of 12. So if we plug in those numbers we see that the mean in this situation is 30 minutes and the standard deviation is 17.321 minutes. However, it is worth noting that the mean and standard deviation for uniform distributions hold no predictive power. This is because all events are equally likely, unlike for example a normal distribution where most of the events are clustered around the mean.

Uniform Distribution Explained with Examples

Поделиться в:

Доступные форматы для скачивания:

Скачать видео mp4

  • Информация по загрузке:

Скачать аудио mp3

Похожие видео

Нормальное распределение ОБЪЯСНЕНО с примерами

Нормальное распределение ОБЪЯСНЕНО с примерами

Discrete uniform distribution

Discrete uniform distribution

हिंदी Electrical Podcasts PDF & CDF

हिंदी Electrical Podcasts PDF & CDF

Бета-распространение через 12 минут!

Бета-распространение через 12 минут!

Continuous Probability Uniform Distribution Problems

Continuous Probability Uniform Distribution Problems

Uniform Distribution versus Normal Distribution

Uniform Distribution versus Normal Distribution

Uniform Distribution EXPLAINED with Examples

Uniform Distribution EXPLAINED with Examples

Секретное оружие для прогнозирования результатов: биномиальное распределение

Секретное оружие для прогнозирования результатов: биномиальное распределение

Экспоненциальное распределение! УДИВИТЕЛЬНОЕ ОБЪЯСНЕНИЕ. Почему оно называется «экспоненциальным»?

Экспоненциальное распределение! УДИВИТЕЛЬНОЕ ОБЪЯСНЕНИЕ. Почему оно называется «экспоненциальным»?

Биномиальные распределения | Вероятности вероятностей, часть 1

Биномиальные распределения | Вероятности вероятностей, часть 1

Uniform Probability Distribution

Uniform Probability Distribution

Understanding Exponential vs Poisson Distributions

Understanding Exponential vs Poisson Distributions

Квартили, децили и процентили с кумулятивной относительной частотой — Данные и статистика

Квартили, децили и процентили с кумулятивной относительной частотой — Данные и статистика

Normal Distribution (PDF, CDF, PPF) in 3 Minutes

Normal Distribution (PDF, CDF, PPF) in 3 Minutes

1-Hour Pink & Orange Aura Study Timer | No Breaks, No Music | Deep Focus ⏳✨

1-Hour Pink & Orange Aura Study Timer | No Breaks, No Music | Deep Focus ⏳✨

Биномиальное распределение ОБЪЯСНЕНО с примерами

Биномиальное распределение ОБЪЯСНЕНО с примерами

Normal Distributions Explained – With Real-World Examples

Normal Distributions Explained – With Real-World Examples

An Introduction to the Continuous Uniform Distribution

An Introduction to the Continuous Uniform Distribution

Standard Normal Distribution Tables, Z Scores, Probability & Empirical Rule  - Stats

Standard Normal Distribution Tables, Z Scores, Probability & Empirical Rule - Stats

Finding The Probability of a Binomial Distribution Plus Mean & Standard Deviation

Finding The Probability of a Binomial Distribution Plus Mean & Standard Deviation

© 2025 dtub. Все права защищены.


  • Контакты
  • О нас
  • Политика конфиденциальности


Контакты для правообладателей: infodtube@gmail.com