Statistics Bio7
Welcome to StatisticsBio7 — your free learning hub for biostatistics, data visualization, and data analysis in biological sciences.
I’m dedicated to creating high-quality tutorials to help students, researchers, and educators worldwide. All content is freely accessible to support open education.
🎓 Support this mission:
If you find the videos helpful, consider supporting this work by donating here:
👉 https://statisticsbio7.blogspot.com/p/support-our-mission-with-donation.html
Every contribution helps keep biostatistics education free and growing.
Thank you for being part of this learning community!

How to Perform Independent t-Test in MedCalc | Medical Statistics Step-by-Step

Одновыборочный t-критерий в MedCalc | Пошаговое руководство по биомедицинским наборам данных | Эп...

Нелинейная регрессия в MedCalc | Пошаговое объяснение модели Михаэлиса–Ментен | Эпизод 22

Пробит-регрессия в MedCalc | Объяснение анализа «доза-ответ» (Эпизод 21)

Логистическая регрессия в MedCalc | Учебное пособие по анализу биомедицинских данных | Эпизод 20

Множественная регрессия в MedCalc | Пошаговое руководство по анализу медицинских исследований | Э...
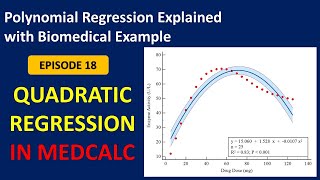
Модель квадратичной регрессии в MedCalc | Полиномиальная регрессия второй степени | Эпизод 18

Регрессионная модель с логарифмически преобразованными обеими переменными (логарифмическая модель...

Regression Model with Response Log-Transformed in MedCalc | Triglycerides Example | Episode 16

Boxplot with Individual Data Points Overlaid in R Studio | ggplot2 Tutorial

Multiple Grouped Box Plot in R Studio | Step-by-Step Tutorial with R Script & Data File

Create Grouped Box Plot in R Studio | Step-by-Step Tutorial with R Script and Data File

Box Plots in R | Create & Customize Boxplots for Data Visualization in RStudio

Log-Transformed Predictor in MedCalc Regression | Episode 15

Interpretation for Simple Linear Regression in MedCalc | Episode 14 (Part 2)

Simple Linear Regression in MedCalc | Step-by-Step Guide with Biomedical Data | Episode 14

Scatter Diagram in MedCalc | Create & Analyze Medical Data Relationships | Episode 13

Rank Correlation in MedCalc | Spearman & Kendall Explained with Biomedical Dataset

Partial Correlation in MedCalc | Control for Variables in Biomedical Data | Episode 11

Correlation Coefficient in MedCalc | Biomedical Data Analysis Tutorial | Episode 10

Box and Whisker Plot in MedCalc | Biomedical Data Visualization | Episode 9

Dot Plot in MedCalc | Biomedical Data Visualization | Episode 8

Normal Distribution Plot in MedCalc | Q-Q Plot | Episode 7

Cumulative Frequency Distribution Plot Interpretation in MedCalc | Biomedical Data | Episode 6A

Cumulative Frequency Distribution Plot in MedCalc | Biomedical Example Explained | Episode 6

Distribution Plot (Histogram) in MedCalc | Visualize Biomedical Data Distribution | Episode 5

Outlier Detection Interpretation in MedCalc | Hemoglobin Data Explained Step-by-Step

Outlier Detection in MedCalc | Identify & Handle Extreme Values in Biomedical Data

Advanced Summary Statistics in MedCalc | Percentiles, Trimmed Mean, Subgroup Analysis

Summary Statistics in MedCalc | Mean, SD, SEM, Min–Max & CI – Explained