How To Build A Dashboard In Apache Superset From Scratch | Part 2: Bar, Pie & KPI Chart
Автор: Build With Wilfred
Загружено: 2025-11-10
Просмотров: 494
Ready to turn your data into actionable insights? In Part 2 of our Apache Superset series, we complete the marketing analytics dashboard by building essential visualizations and adding interactivity.
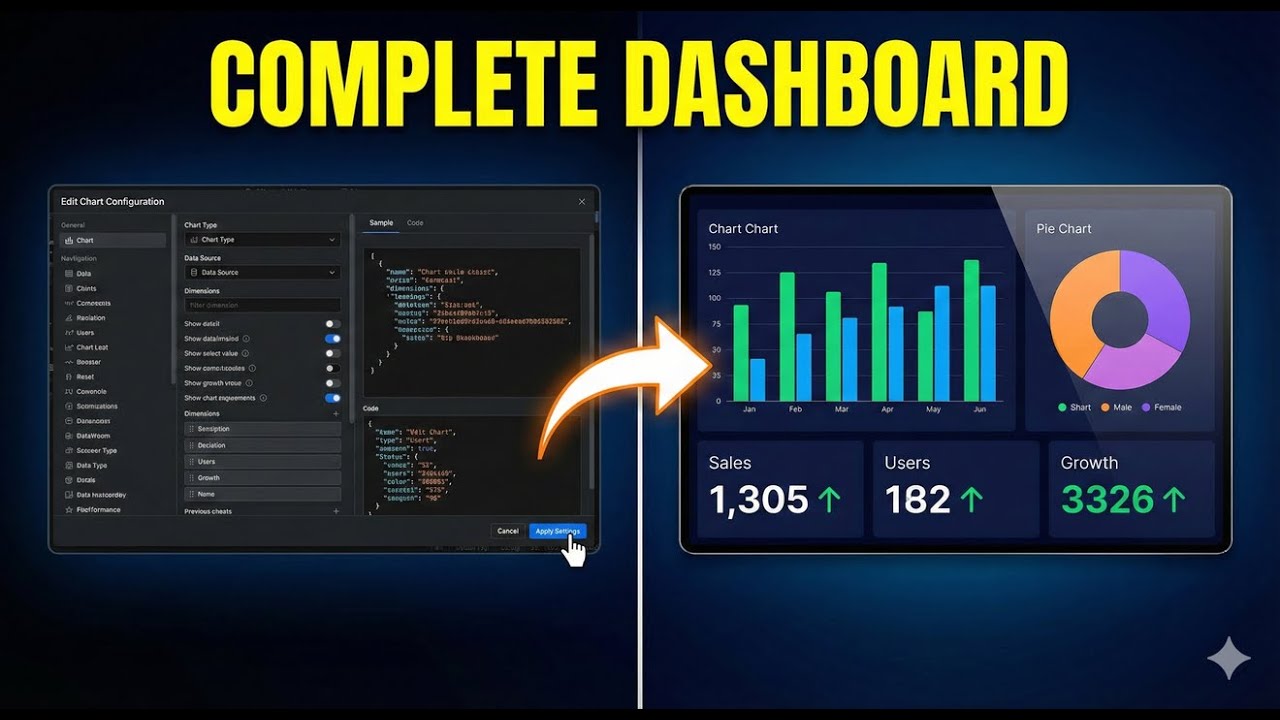
This tutorial guides you step-by-step through creating specific chart types that every data analyst needs to master. We move beyond the basics to construct a fully functional, professional-grade dashboard. You will learn how to visualize "Leads by Platform" and "Campaign Performance" effectively, ensuring your stakeholders can make data-driven decisions instantly.
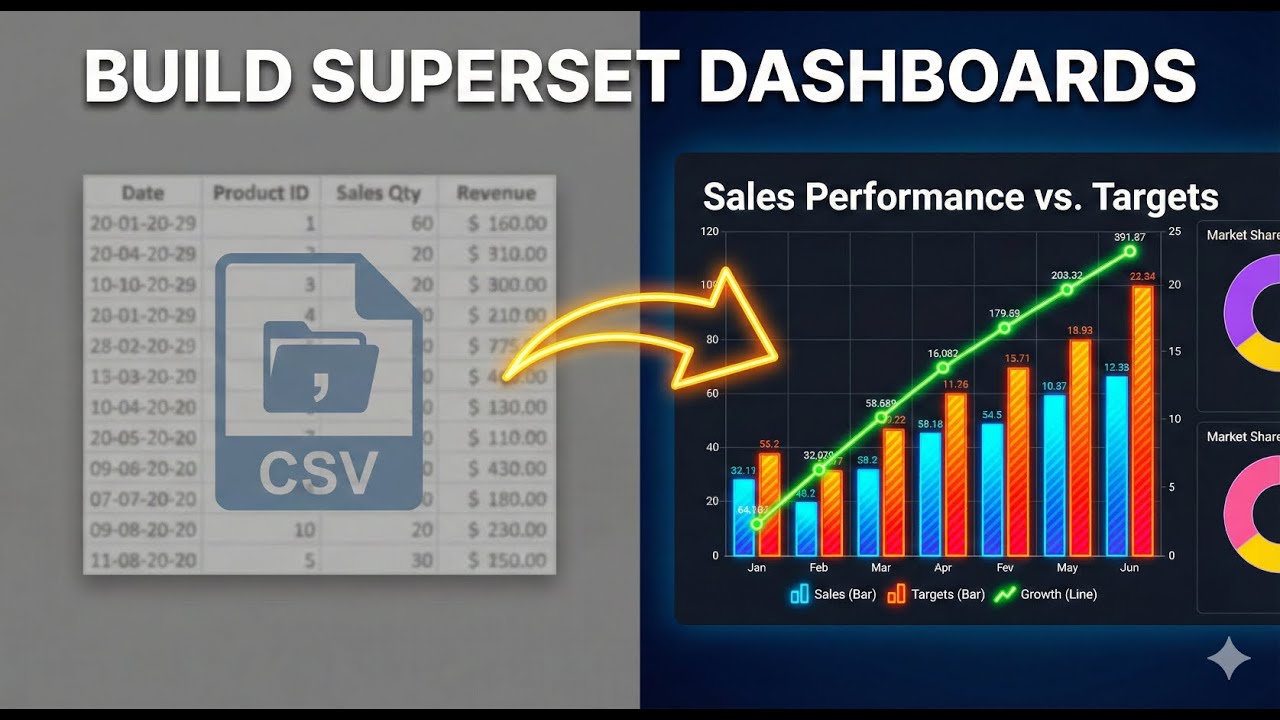
In this follow-up to Part 1, we expand our Apache Superset tutorial by creating a Bar Chart, a Pie Chart, and a KPI Chart that bring your marketing data to life. You’ll learn how to add powerful dashboard filters that let users segment and analyze campaigns effortlessly.
✅ WHAT YOU WILL LEARN IN THIS VIDEO:
• BAR CHARTS: How to group data by dimensions (like Platform) for clear comparisons.
• KPI / BIG NUMBER CHARTS: Displaying critical metrics like "Total Conversions" for immediate impact.
• PIE CHARTS: Visualizing part-to-whole relationships for your campaigns.
• DASHBOARD LAYOUT: Drag-and-drop techniques to organize your charts into a clean, readable grid.
• INTERACTIVE FILTERS: Adding specific filters (e.g., by Platform) that dynamically update the entire dashboard.
➡️ WATCH PART 1 FIRST: • How To Build A Dashboard In Apache Superse...
TIMESTAMPS
00:00 Introduction & Recap
00:26 Building the Bar Chart (Leads by Platform)
03:07 Creating the KPI Chart (Total Conversions)
04:48 Designing the Pie Chart (Leads by Campaign)
07:25 Assembling the Dashboard Layout
09:40 Adding Interactive Filters
11:50 Final Review & Conclusion
#ApacheSuperset #DataVisualization #DashboardDesign #BusinessIntelligence #DataAnalytics #opensourcebi
Доступные форматы для скачивания:
Скачать видео mp4
-
Информация по загрузке: