How To Build A Dashboard In Apache Superset From Scratch | Part 1: Line & Mixed Charts
Автор: Build With Wilfred
Загружено: 2025-11-05
Просмотров: 426
Are your numbers scattered across files, making it hard to find the story hiding underneath? In this video, we uncover that story using Apache Superset.
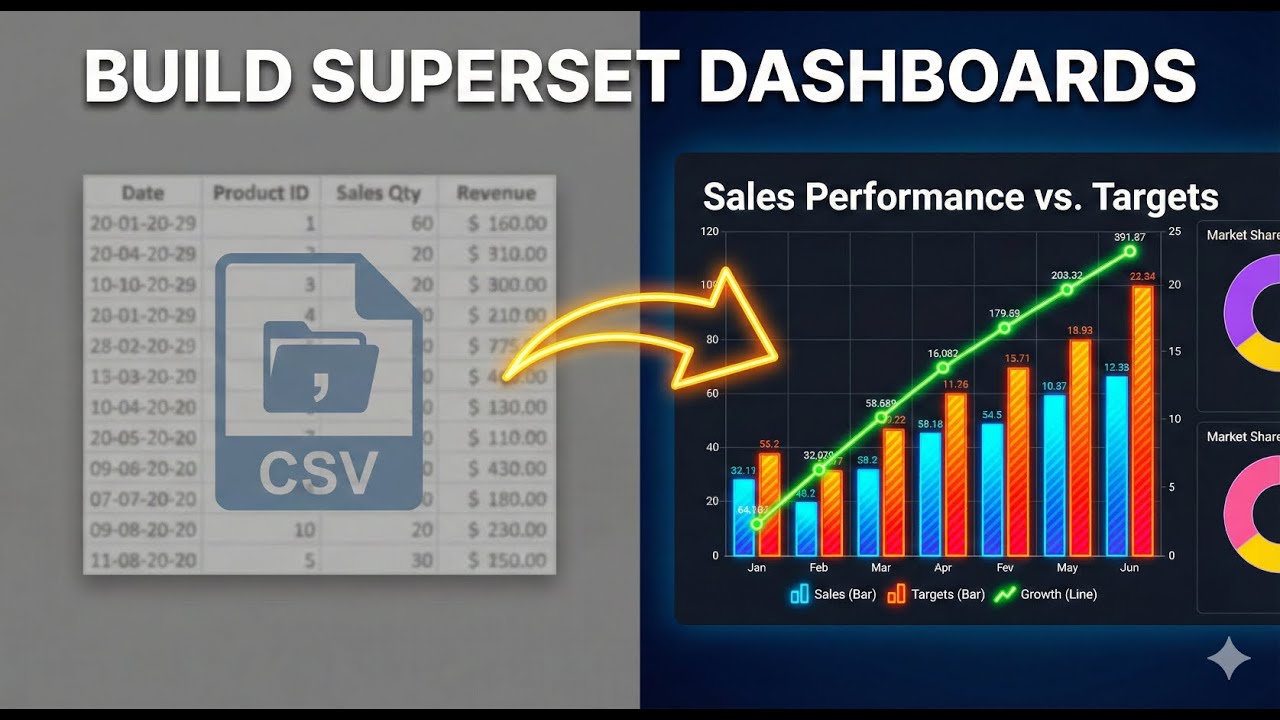
This is Part 1 of a series where we walk through the entire process of visualizing data starting from a simple CSV file. You will learn how to configure Superset to accept CSV uploads, build a LINE CHART to track campaign costs over time, and master the MIXED CHART to compare valid leads versus total generated leads.
By the end of this tutorial, you will have the foundation of a professional dashboard that turns raw data into actionable insights.
IN THIS VIDEO, YOU WILL LEARN:
➡️ How to ENABLE CSV UPLOADS in Apache Superset settings.
➡️ The step-by-step process to IMPORT YOUR DATASET correctly.
➡️ Creating and customizing a LINE CHART for financial metrics.
➡️ Building a MIXED CHART to compare different data sets (Line + Bar).
➡️ Tips on formatting axes, adding currency symbols, and customizing legends.
Watch the full series to master data visualization with Apache Superset!
👇 SUBSCRIBE TO BUILD WITH WILFRED CHANNEL NOW 👇 / @buildwithwilfred
Tutorial Dataset: https://drive.google.com/file/d/1OKX0...
00:00 Introduction to Data Storytelling
00:40 Enabling CSV Uploads in Settings
01:30 Uploading the Campaign Dataset
02:00 Creating a Line Chart (Cost Analysis)
03:00 Customizing Chart Axes & Formatting
04:48 Building a Mixed Chart (Leads Comparison)
06:50 Combining Line and Bar Visualizations
08:40 Renaming Legends & Finalizing
09:15 Conclusion
#ApacheSuperset #DataVisualization #BusinessIntelligence #DashboardDesign #DataAnalytics
#MarketingDashboard #Tutorial #CSVtoChart #MarketingAnalytics #OpenSourceBI
Доступные форматы для скачивания:
Скачать видео mp4
-
Информация по загрузке: