From Variables to Hypotheses: The Complete Chi-Square Tutorial.
Загружено: 2025-06-14
Просмотров: 497
Understanding Chi Square Test in Community Medicine | Statistical Problems Part 4
In the fourth part of our series on Statistical Problems in Community Medicine, we delve into the Chi Square test. Learn about the purpose, steps, and interpretation of the Chi Square test, along with crucial concepts like types of errors, hypothesis testing, and P value. This comprehensive guide details the classification of variables, calculation methods, and interpretation of results, making it an essential watch for anyone looking to master statistical tests. Don't miss out on this in-depth tutorial!
00:00 Introduction to Chi Square Test
01:07 Understanding Types of Variables
03:21 Purpose of Chi Square Test
04:24 Hypothesis in Statistical Tests
05:23 Types of Errors: Alpha and Beta
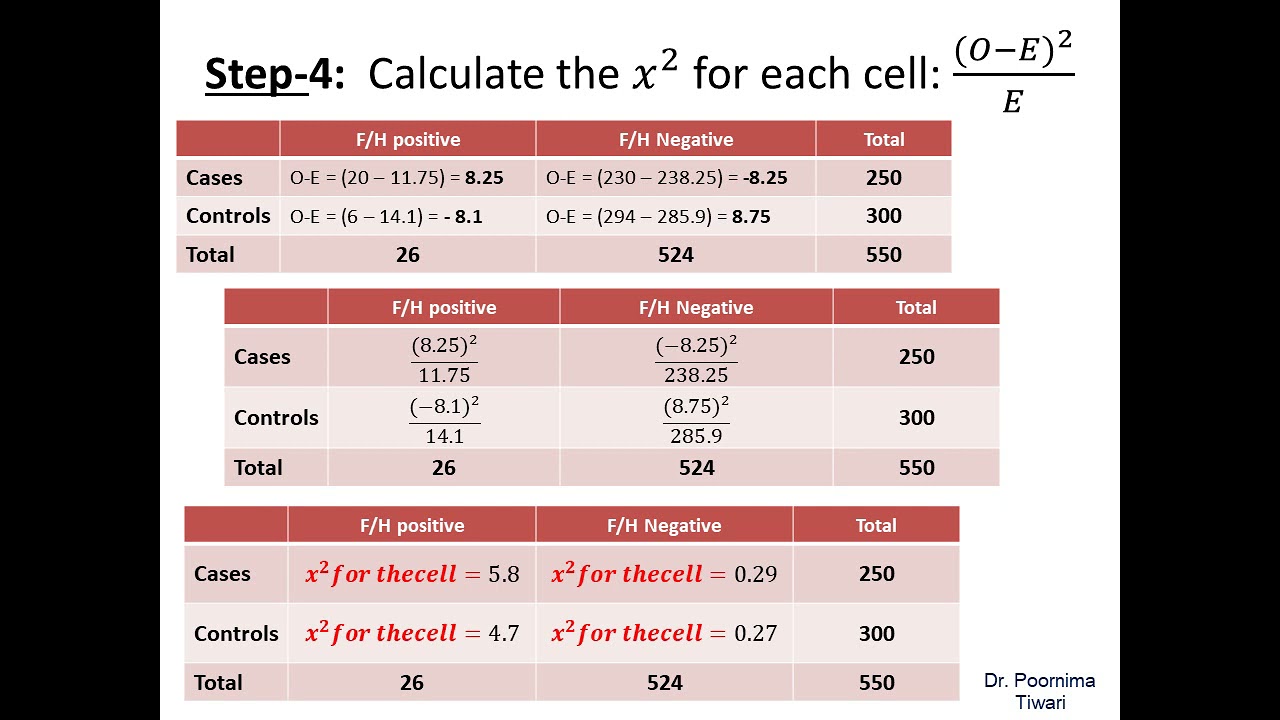
09:06 Calculating Chi Square Value
14:38 Degree of Freedom and P Value
19:38 Conclusion and Summary
The Chi-Square (χ
2
) Test of Independence is a statistical test used to determine if there is a significant association between two categorical variables. In simpler terms, it helps you figure out if the two variables are related or independent of each other within a given population.
For example, you might use it to answer questions like:
Is there a relationship between a person's gender (Male/Female) and their preference for a certain type of movie (Action/Comedy/Drama)?
Is there an association between smoking status (Smoker/Non-smoker) and the occurrence of a lung disease (Yes/No)?
Does a student's mode of transportation to school (Bus/Car/Walk) depend on their grade level (Primary/Secondary/High School)?
Key Concepts:
Categorical Variables: Both variables you are testing must be categorical (nominal or ordinal). This means their values fall into distinct categories (e.g., "Male" or "Female", "Yes" or "No", "High," "Medium," or "Low").
Contingency Table (Cross-Tabulation): The data for a Chi-Square Test of Independence is typically organized into a table where the rows represent the categories of one variable and the columns represent the categories of the other variable. Each cell in the table contains the observed frequency (count) of cases that fall into that specific combination of categories.
Steps to Perform a Chi-Square Test of Independence:
State the Hypotheses:
Null Hypothesis (H
0
): The two categorical variables are independent (i.e., there is no association between them in the population).
Example: Gender is independent of movie preference.
Alternative Hypothesis (H
1
): The two categorical variables are not independent (i.e., there is a statistically significant association between them in the population).
Example: Gender is not independent of movie preference (there is an association).
Determine the Significance Level (α):
This is your threshold for deciding statistical significance, usually set at α=0.05 (or 5%).
Calculate Expected Frequencies (E):
For each cell in your contingency table, calculate the expected frequency under the assumption that the null hypothesis (independence) is true.
The formula for the expected frequency of a cell is: E=
Grand Total
(Row Total)×(Column Total)
You would calculate this for every cell in your table.
Calculate the Chi-Square Test Statistic (χ
2
):
This statistic measures the discrepancy between your observed frequencies (O) and your expected frequencies (E).
The formula is: χ
2
=∑
E
(O−E)
2
Where:
O = Observed frequency in each cell.
E = Expected frequency in each cell.
∑ = Sum of this calculation for all cells in the table.
Make a Decision and Conclude:
If p-value ≤α: Reject the null hypothesis. There is statistically significant evidence to conclude that the two categorical variables are not independent (i.e., there is an association between them).
If p-value $ greater than \alpha$: Fail to reject the null hypothesis. There is not enough statistically significant evidence to conclude that the two categorical variables are associated.
Assumptions of the Chi-Square Test of Independence:
Categorical Data: Both variables must be categorical.
Independence of Observations: Each observation (individual or case) must contribute data to only one cell in the contingency table. You cannot use this test for "paired" or "repeated measures" data (e.g., before-and-after measurements on the same people).
Random Sampling: The data should come from a random sample of the population.
Expected Frequencies: This is a crucial assumption.
No more than 20% of the cells should have an expected frequency less than 5.
No cell should have an expected frequency less than 1.
If this assumption is violated, the chi-square approximation may not be accurate, and alternatives like Fisher's Exact Test (especially for 2x2 tables with small counts) or combining categories might be necessary.

Доступные форматы для скачивания:
Скачать видео mp4
-
Информация по загрузке:


![Chi-Square Test [Simply explained]](https://imager.clipsaver.ru/rpKzq64GA9Y/max.jpg)