Visualize any Data Easily, from Notebooks to Dashboards | Scipy 2019 Tutorial | James Bednar
Автор: Enthought
Загружено: 2019-07-11
Просмотров: 24499
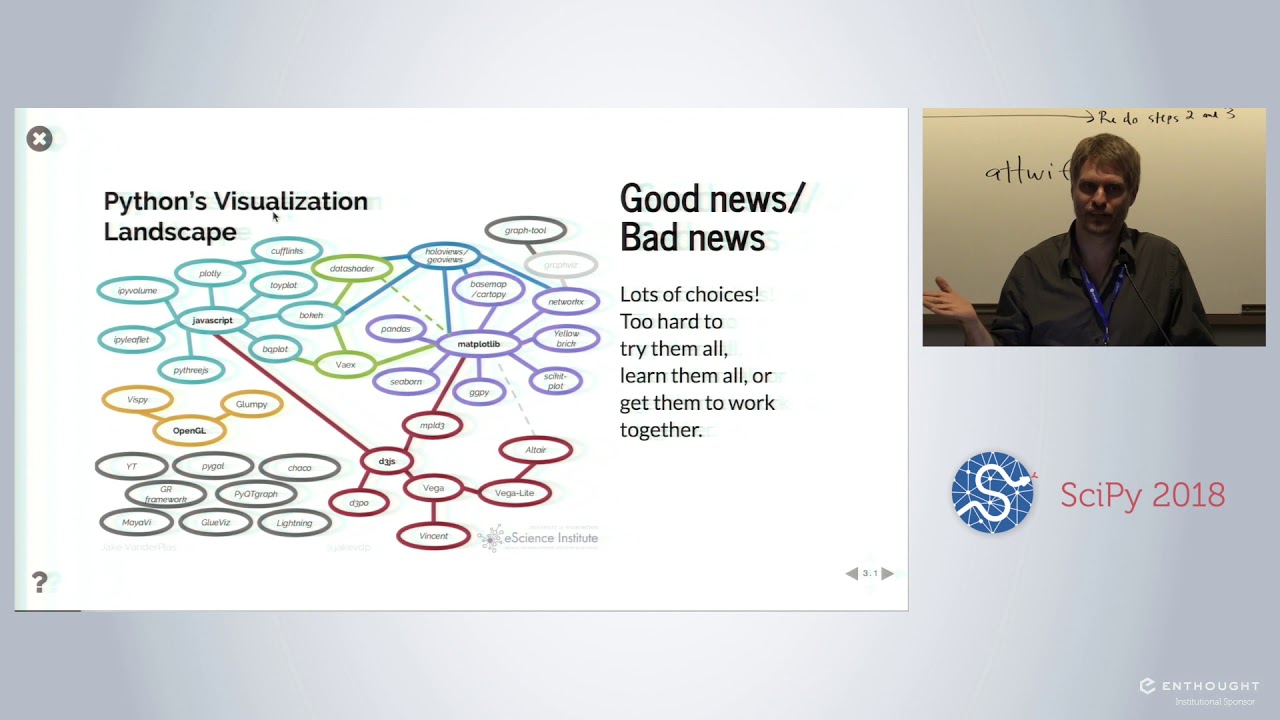
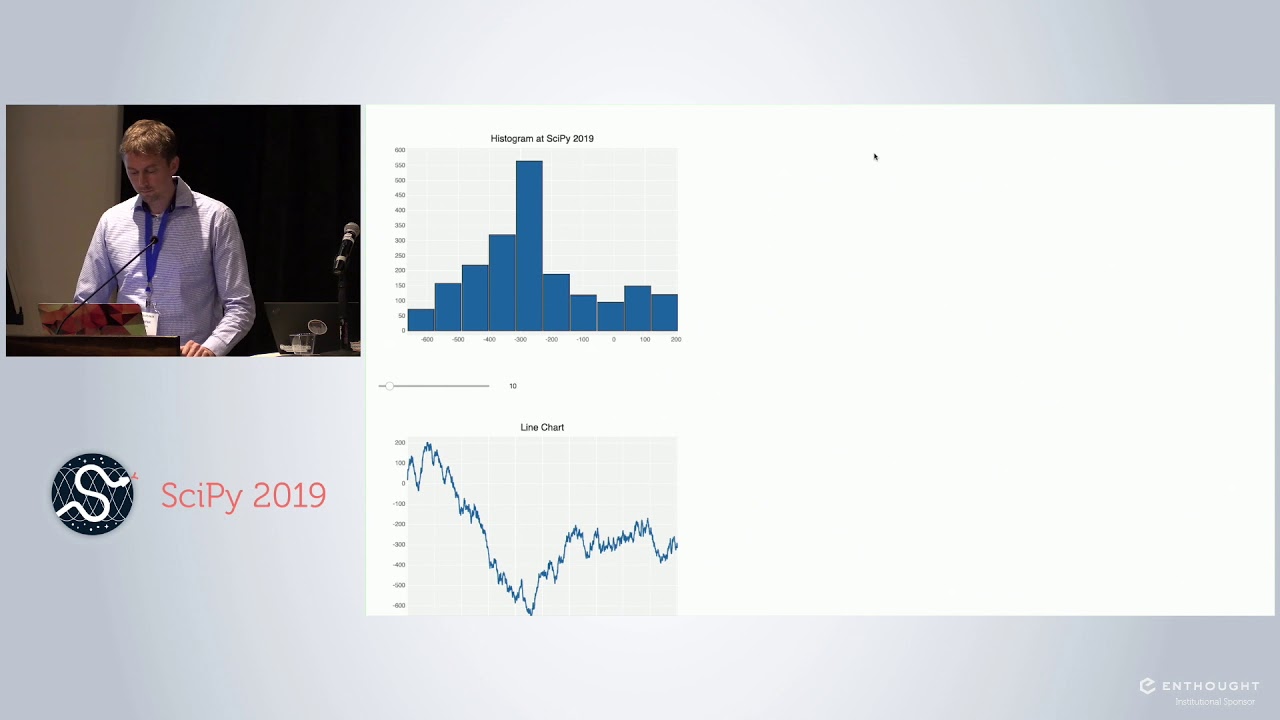
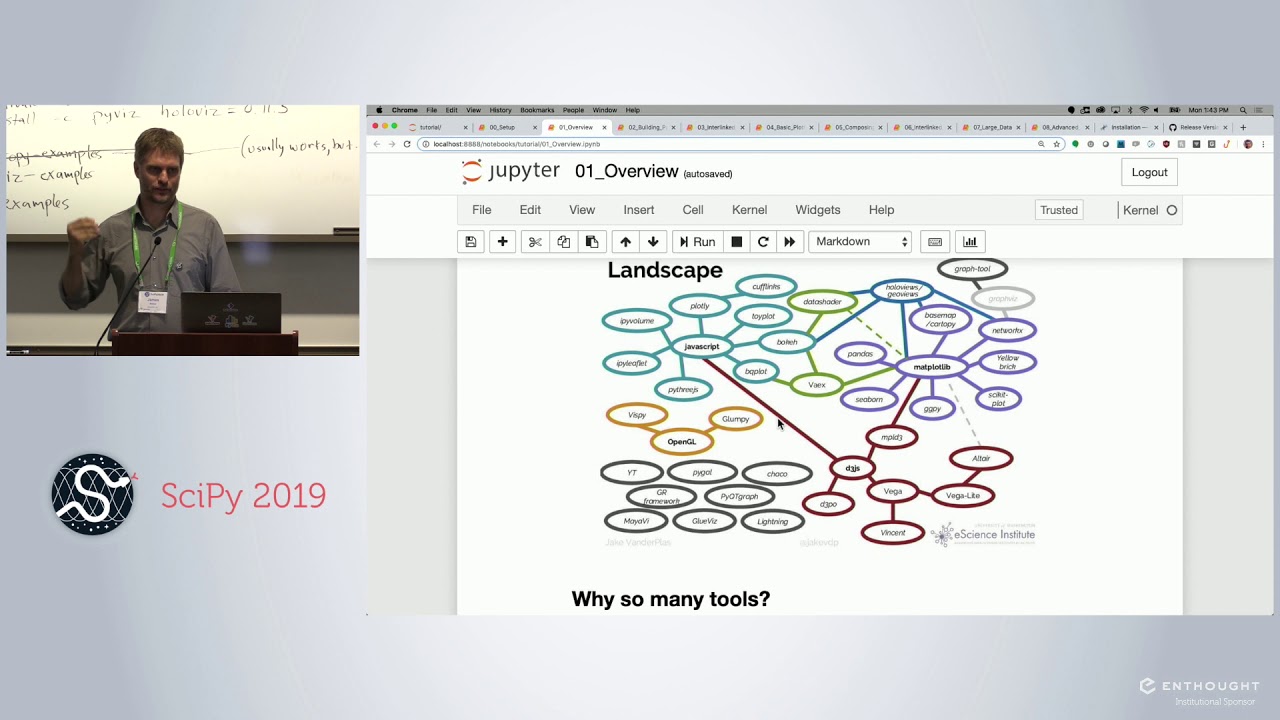
In this tutorial you will see how to visualize and communicate your data easily and effectively using Python tools. You'll learn how to use Panel to lay out your existing plots with widgets to make apps in the notebook or as deployed dashboards, hvPlot to make your Pandas or Xarray .plot() API calls return interactive, explorable plots, HoloViews and GeoViews to help you explore multidimensional data naturally without having to build a plot for each combination or sample of the data space, and Datashader to visualize even the very largest datasets faithfully in a web browser. See pyviz.org for links to all these tools and more.
See tutorial materials here: https://www.scipy2019.scipy.org/tutor...
See the full SciPy 2019 playlist at • SciPy 2019: Scientific Computing with Pyth...
Connect with us!
*****************
/ enthought
/ enthought
/ enthought
Доступные форматы для скачивания:
Скачать видео mp4
-
Информация по загрузке: