Популярное

Музыка Кино и Анимация Автомобили Животные Спорт Путешествия Игры Юмор

Интересные видео

2025 Сериалы Трейлеры Новости Как сделать Видеоуроки Diy своими руками

Топ запросов

смотреть а4 schoolboy runaway турецкий сериал смотреть мультфильмы эдисон
dTub
Скачать

James A Bednar: Panel: Dashboards for PyData | PyData Austin 2019

Автор: PyData

Загружено: 2019-12-18

Просмотров: 11779

Описание:

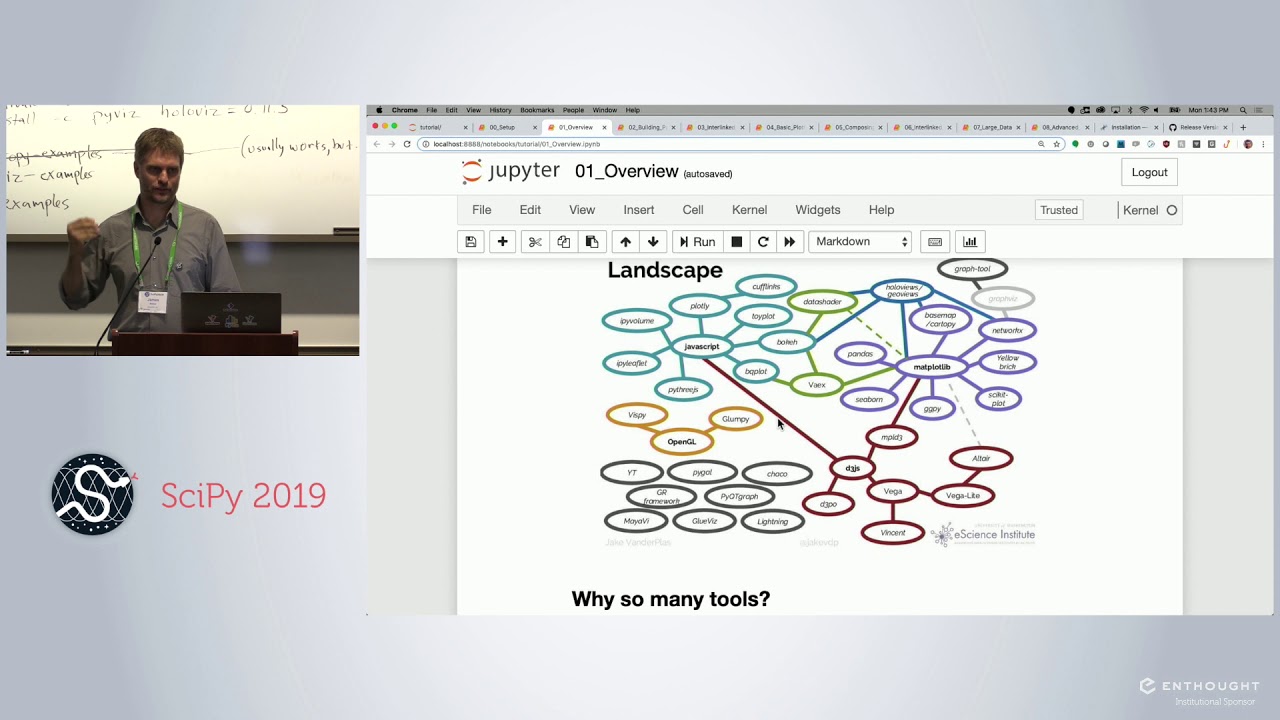
The PyData ecosystem is rich with tools for working with and visualizing data. Until recently, it has been difficult to put these tools together into a shareable application to let non-Python users explore and make use of the data. The new tools Panel (https://panel.pyviz.org) and Voila (https://github.com/voila-dashboards/v...) make it much simpler to build, adapt, and explore your data, moving seamlessly between Jupyter notebooks and deployed web applications. Here, we will show you how to get started using Panel to build apps and dashboards in notebooks and make them into deployable web applications.

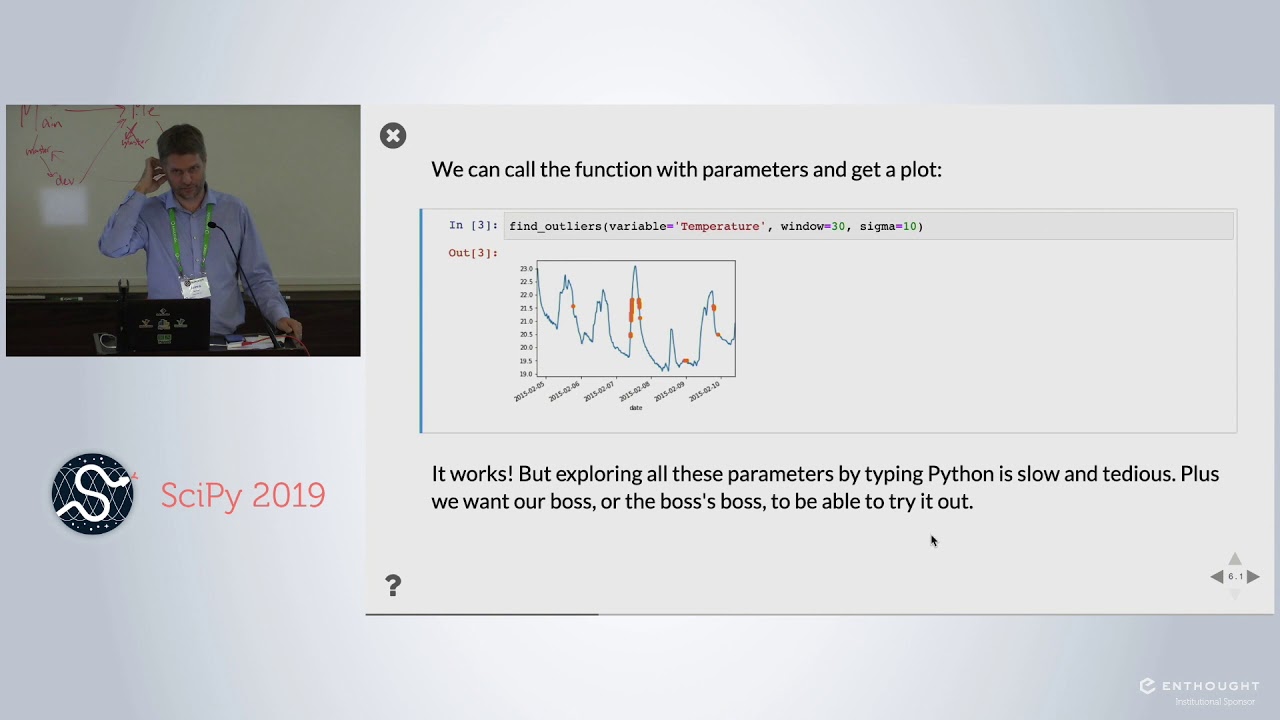
In this tutorial, you will see how to use Panel (https://panel.pyviz.org) to add widgets and layouts to the output from just about any plotting program, and then how to share the result as a fully standalone application. You should walk away knowing you can very easily make any of your analyses interactive and shareable, in just a few lines of code!

www.pydata.org

PyData is an educational program of NumFOCUS, a 501(c)3 non-profit organization in the United States. PyData provides a forum for the international community of users and developers of data analysis tools to share ideas and learn from each other. The global PyData network promotes discussion of best practices, new approaches, and emerging technologies for data management, processing, analytics, and visualization. PyData communities approach data science using many languages, including (but not limited to) Python, Julia, and R.

PyData conferences aim to be accessible and community-driven, with novice to advanced level presentations. PyData tutorials and talks bring attendees the latest project features along with cutting-edge use cases. 00:00 Welcome!
00:10 Help us add time stamps or captions to this video! See the description for details.

Want to help add timestamps to our YouTube videos to help with discoverability? Find out more here: https://github.com/numfocus/YouTubeVi...

James A Bednar: Panel: Dashboards for PyData | PyData Austin 2019

Поделиться в:

Доступные форматы для скачивания:

Скачать видео mp4

  • Информация по загрузке:

Скачать аудио mp3

Похожие видео

Travis E Oliphant: uarray: Separating interface from implementation | PyData Austin 2019

Travis E Oliphant: uarray: Separating interface from implementation | PyData Austin 2019

James Powell: Objectionable Content | PyData Austin 2019

James Powell: Objectionable Content | PyData Austin 2019

hvPlot and Panel: Visualize all your data easily, from notebooks to dashboards | SciPy 2023

hvPlot and Panel: Visualize all your data easily, from notebooks to dashboards | SciPy 2023

Python Dashboarding Shootout and Showdown | PyData Global 2021

Python Dashboarding Shootout and Showdown | PyData Global 2021

Visualize any Data Easily, from Notebooks to Dashboards | Scipy 2019 Tutorial | James Bednar

Visualize any Data Easily, from Notebooks to Dashboards | Scipy 2019 Tutorial | James Bednar

6 лучших инструментов для превращения кода в красивые диаграммы

6 лучших инструментов для превращения кода в красивые диаграммы

Discover our data visualization toolkits

Discover our data visualization toolkits

James Powell: So you want to be a Python expert? | PyData Seattle 2017

James Powell: So you want to be a Python expert? | PyData Seattle 2017

System Design Concepts Course and Interview Prep

System Design Concepts Course and Interview Prep

Xarray & Dask Tutorial | Dask Down Under: Introduction to Xarray & Dask | Dask Summit 2021

Xarray & Dask Tutorial | Dask Down Under: Introduction to Xarray & Dask | Dask Summit 2021

Ian Ozsvald: A gentle introduction to Pandas timeseries and Seaborn | PyData London 2019

Ian Ozsvald: A gentle introduction to Pandas timeseries and Seaborn | PyData London 2019

The Jupyter Interactive Widget Ecosystem | Scipy 2019 Tutorial | Breddels, Craig, Grout, Renou

The Jupyter Interactive Widget Ecosystem | Scipy 2019 Tutorial | Breddels, Craig, Grout, Renou

Introduction to Panel from PyData Global 2021

Introduction to Panel from PyData Global 2021

How to Create a Beautiful Python Visualization Dashboard With Panel/Hvplot

How to Create a Beautiful Python Visualization Dashboard With Panel/Hvplot

Turn any Notebook into a Deployable Dashboard | SciPy 2019 | James Bednar

Turn any Notebook into a Deployable Dashboard | SciPy 2019 | James Bednar

Adrien Treuille: Turn Python Scripts into Beautiful ML Tools | PyData LA 2019

Adrien Treuille: Turn Python Scripts into Beautiful ML Tools | PyData LA 2019

Ушла эпоха 11,5 лет озвучивания Веритасиум

Ушла эпоха 11,5 лет озвучивания Веритасиум

Tailai Wen: ADTK: An open-source Python toolkit for anomaly detection in... | PyData Austin 2019

Tailai Wen: ADTK: An open-source Python toolkit for anomaly detection in... | PyData Austin 2019

Для Чего РЕАЛЬНО Нужен был ГОРБ Boeing 747?

Для Чего РЕАЛЬНО Нужен был ГОРБ Boeing 747?

015 Demystifying Graph Analytics With Visualization - NODES2022 - Corey Lanum

015 Demystifying Graph Analytics With Visualization - NODES2022 - Corey Lanum

© 2025 dtub. Все права защищены.


  • Контакты
  • О нас
  • Политика конфиденциальности


Контакты для правообладателей: infodtube@gmail.com