Скачать
What do all those lines and colors mean? Interpreting cancer data plots.
Автор: IASLC IASLC
Загружено: 2021-08-27
Просмотров: 21171
Описание:
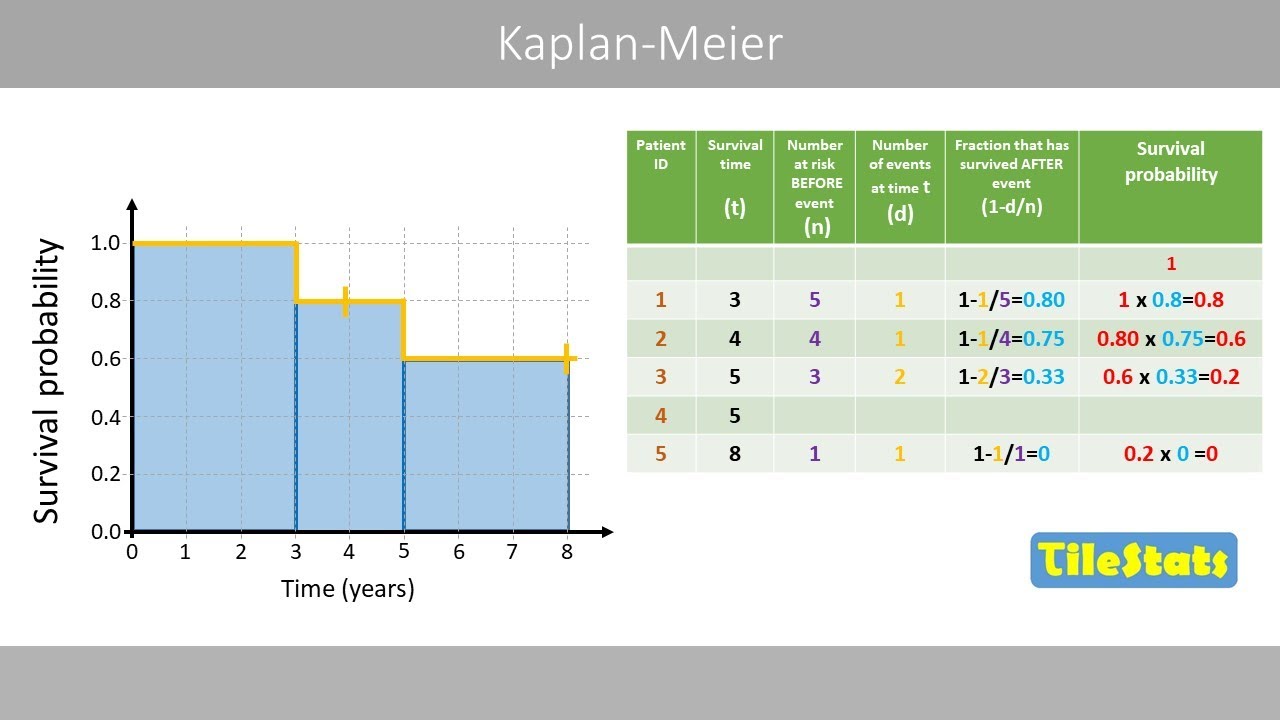
Join a cancer scientist and research advocate as they discuss common charts, graphs, and terms used to describe clinical trial results and data at a level understandable by the general public. This webinar will help equip patients/survivors, caregivers, and research advocates with the skills to understand these data plots when they are shared with a journal article or quickly during a conference presentation.

Доступные форматы для скачивания:
Скачать видео mp4
-
Информация по загрузке: