Популярное

Музыка Кино и Анимация Автомобили Животные Спорт Путешествия Игры Юмор

Интересные видео

2025 Сериалы Трейлеры Новости Как сделать Видеоуроки Diy своими руками

Топ запросов

смотреть а4 schoolboy runaway турецкий сериал смотреть мультфильмы эдисон
dTub
Скачать

Power BI Report with Decomposition Tree : AI Artificial Intelligence Part 2 with FREE PBIX DOWNLOAD.

Автор: Lighthouse Analytix

Загружено: 2022-11-27

Просмотров: 2650

Описание:

Six important facts about Decomposition Tree & step by step tutorial on how to rebuild the Power BI report from scratch.

This video is a continuation of video from last week, when I have started to show case how to rebuild a Power BI report with Artificial Intelligence features which I came across from PBI learning portal, from scratch.

If you haven't watched my previous video from last week, where I went through Artificial Intelligence features in Power BI - Key Influencer Visuals. here is the link:
   • Power BI Report with Key Influencer : AI A...  

In this video, I will focus on:
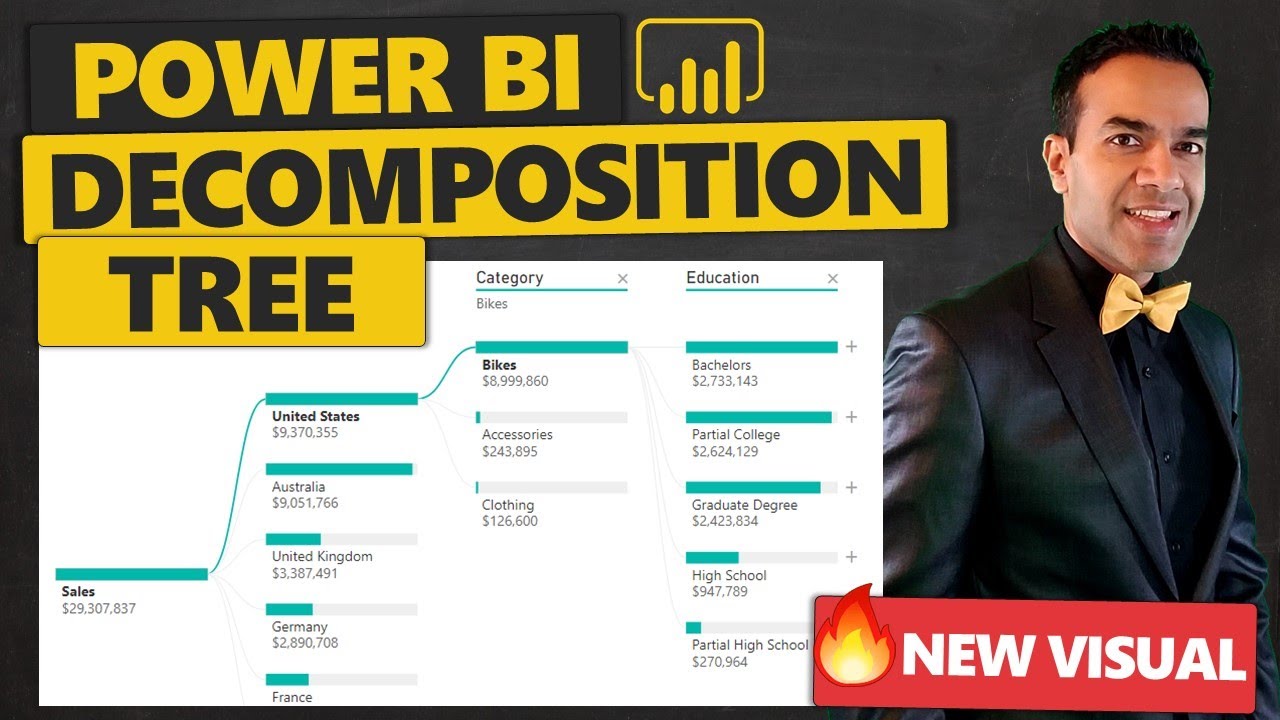
Explaining how to read & understand the Decomposition Tree Visuals in Power BI service
Showing how to rebuild the Decomposition tree page from scratch in Power BI desktop

In a nutshell, when you are trying to make sense of a decomposition tree in Power BI…., you need to understand six important facts:
1. Each layer is showing the sum of the previous level.
2. If we select different box…. Then we get the breakdown of those boxes in the subsequent boxes.
3. You can reset the AI analysis by clicking and double clicking the roots.
4. The AI result of the analysis are presented on top of the report.
You can hover to the lightbulb sign…to read the outcome of the AI analysis.
This result is dynamic
5. Manual selection is shown as solid lines… and AI analysis is shown as dotted line.
6. User have the freedom to reset the analysis, by clicking the cross sign.

Many people don't realize that Decomposition Tree visuals provide freedom to restart the analysis from scratch in Power BI service and allow users to choose whether we want to utilize the artificial intelligence features, i.e. High Analysis or Low Analysis, or a user defined selections.

Hope you enjoy this video and will gain more familiarity, comfort and confidence in using the decomposition tree visuals in your future Power BI report.

Caveat:
AI features within decomposition tree is not currently available with direct connection model, such as AAS model, as of 28.11.2022. I sincerely hope that this will be made available by Microsoft in the near future.

Kind regards,
Isabella Susilowati ‪@LighthouseAnalytix‬ , #Powerbi, #powerbitutorial, #powerbiforbeginners

Timeline
00:00 Intro
00:55 Decomposition Tree Deep Dive
01:28 Fact1
01:42 Fact2
02:00 Fact3
02:08 Fact4
03:05 Fact5
03:29 Fact6
04:03 AI High Value Analysis
05:50 AI Low Value Analysis
06:38 User Defined Analysis
08:45 Let's Recreate
16:15 Epilogue

LA69
The PBIX file that I used in this video can be downloaded via my website: https://lighthouseanalytix.com/tutori...
Look for AI in Power BI.

Power BI Report with Decomposition Tree : AI Artificial Intelligence Part 2 with FREE PBIX DOWNLOAD.

Поделиться в:

Доступные форматы для скачивания:

Скачать видео mp4

  • Информация по загрузке:

Скачать аудио mp3

Похожие видео

Power BI Anomaly Detection + Smart Narratives + Q&A + Analyze : AI Artificial Intelligence Part 3

Power BI Anomaly Detection + Smart Narratives + Q&A + Analyze : AI Artificial Intelligence Part 3

Освоение дерева декомпозиции в Power BI

Освоение дерева декомпозиции в Power BI

Decomposition Tree - AI Visuals in Power BI

Decomposition Tree - AI Visuals in Power BI

Power BI Report with Key Influencer : AI Artificial Intelligence Part 1 + FREE PBIX DOWNLOAD

Power BI Report with Key Influencer : AI Artificial Intelligence Part 1 + FREE PBIX DOWNLOAD

How to Display Last (Rolling) 12 or 13 Months in Timeseries Charts in Power BI

How to Display Last (Rolling) 12 or 13 Months in Timeseries Charts in Power BI

AI Data Analysis with the Decomposition Tree in PowerBI

AI Data Analysis with the Decomposition Tree in PowerBI

Use Decomposition Tree to Explore and Analyse your Data // Beginners Guide to Power BI in 2021

Use Decomposition Tree to Explore and Analyse your Data // Beginners Guide to Power BI in 2021

Как читать диаграммы типа «ящик» и рассказывать историю! // Руководство для начинающих по Power BI

Как читать диаграммы типа «ящик» и рассказывать историю! // Руководство для начинающих по Power BI

Удобные отчеты Power BI со встроенной справкой!

Удобные отчеты Power BI со встроенной справкой!

Power BI DECOMPOSITION TREE: PBI MasterClass!!!

Power BI DECOMPOSITION TREE: PBI MasterClass!!!

Используйте дерево декомпозиции Power BI для исследования и анализа данных

Используйте дерево декомпозиции Power BI для исследования и анализа данных

How to use the Narrative Visual with Copilot in Power BI - AI Visuals in Power BI

How to use the Narrative Visual with Copilot in Power BI - AI Visuals in Power BI

Add Buttons and take your Decomposition Tree Visual to Next Level | Power BI Tutorial

Add Buttons and take your Decomposition Tree Visual to Next Level | Power BI Tutorial

ОБЫЧНЫЙ VPN УМЕР: Чем обходить блокировки в 2026

ОБЫЧНЫЙ VPN УМЕР: Чем обходить блокировки в 2026

Power BI Org Chart: Impress HR in 10 Minutes!

Power BI Org Chart: Impress HR in 10 Minutes!

Decomposition Tree Visual || Adding Tooltip in visual || Power BI for Beginners || PBI 2023 ||

Decomposition Tree Visual || Adding Tooltip in visual || Power BI for Beginners || PBI 2023 ||

Create an Insightful and Stunning Pareto Table in Power BI 🤯

Create an Insightful and Stunning Pareto Table in Power BI 🤯

Quadrant Charts in Power BI – But Smarter. Cleaner. Next Level.

Quadrant Charts in Power BI – But Smarter. Cleaner. Next Level.

Power BI Report Data Model to Easily Compare Across Two Periods with Simple Waterfall Chart & Tables

Power BI Report Data Model to Easily Compare Across Two Periods with Simple Waterfall Chart & Tables

Программа «Статус» с Екатериной Шульман и Максимом Курниковым | 20.01.2026

Программа «Статус» с Екатериной Шульман и Максимом Курниковым | 20.01.2026

© 2025 dtub. Все права защищены.


  • Контакты
  • О нас
  • Политика конфиденциальности


Контакты для правообладателей: infodtube@gmail.com