Популярное

Музыка Кино и Анимация Автомобили Животные Спорт Путешествия Игры Юмор

Интересные видео

2025 Сериалы Трейлеры Новости Как сделать Видеоуроки Diy своими руками

Топ запросов

смотреть а4 schoolboy runaway турецкий сериал смотреть мультфильмы эдисон
dTub
Скачать

NORMAL DISTRIBUTION EXPLAINED WITH EXAMPLE

Автор: Lucas Learns

Загружено: 2024-03-21

Просмотров: 814

Описание:

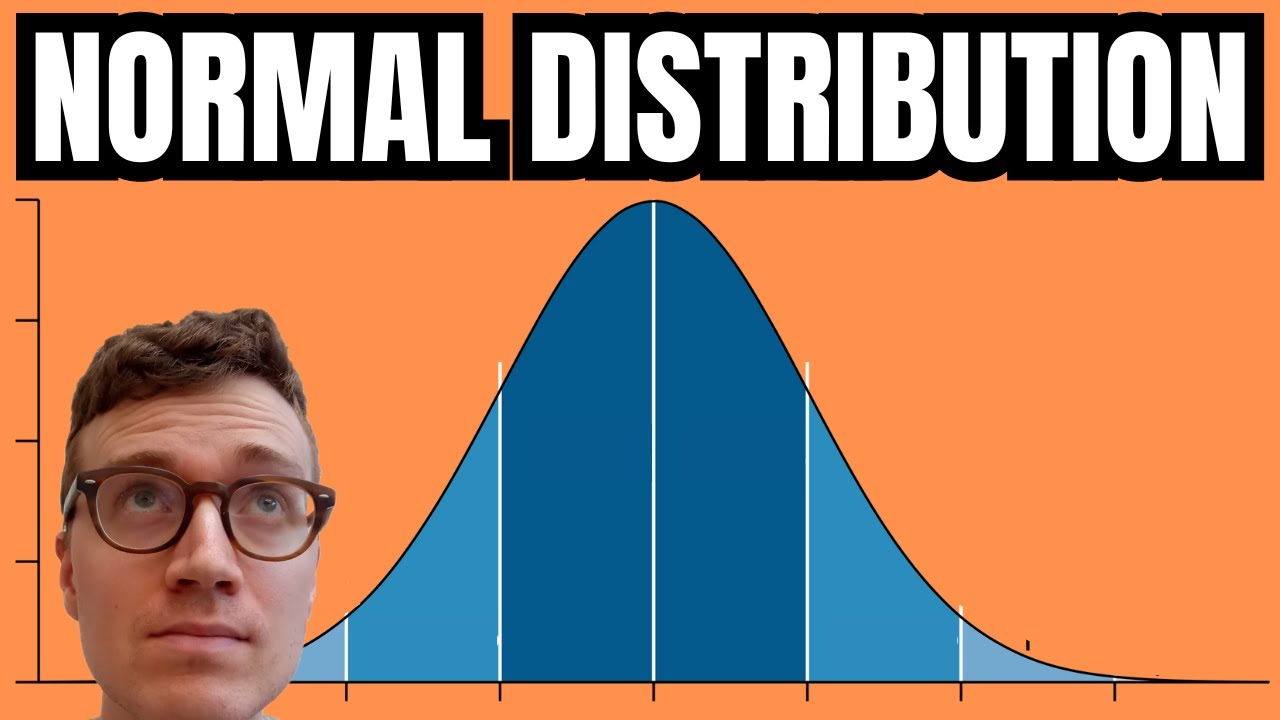
A dataset which follows a normal distribution can be visualized using a symmetrical bell shaped curve, where the mean is the middle point of the curve and the curve stretches 3 standard deviations to both sides of the mean. A normal distribution curve is drawn so that:

68.2% of the data fall within plus, minus 1 standard deviation of the mean,
95.4% of the data fall within plus, minus 2 standard deviations of the mean,
99.7% of the data fall within plus, minus 3 standard deviations of the mean.

Many things follow this normal distribution in nature, such as height and weight. The normal distribution is standardised using Z-scores, to make it applicable across different domains. The Z-score is calculated by subtracting the mean of the data set from a select point in the dataset and dividing the difference with the standard deviation. Then a “Z-score table” is used to convert the Z-score into probabilities. A Z-score table shows the area under the curve to the left of the Z-score. Or in other words, the probability that an event is less or equal to the Z-score. The red part of the Z-score table shows the area below the mean and the green part of the Z-score table shows the area above the mean.

Let’s use an example to clarify all of this.

Let’s say that the average height for men in Finland is 180 centimetres, with a standard deviation of 5 centimetres. I’m a Finnish man of 187 centimetres so with that in mind, what is the probability that another Finnish man is taller than me? I’ll start by calculating my own Z-score by subtracting the mean height (180 centimetres) from my own height of 187 centimetres and dividing the result by the standard deviation of 5 centimetres. This would mean that the Z-score for my height would be 1.4. Now we look at a Z-score table to determine the probability. Since the Z-score is POSITIVE we look at the GREEN part of the table. From the green part of the Z-score table we can see that the probability that someone is as tall or shorter than me is 91.924%. Again, this is because the Z-score table gives us the probability that a data points exist to the LEFT of the Z-score. This means that we can calculate the probability that someone would be taller than me by taking 100%-91.924%, because that is just how probabilities work. In other words, in this example at least, ONLY 8.076% of Finnish men are taller than me. However, before I let it get to my head, I want to clarify that the data I used was just based on some quick googling and best guesses.

NORMAL DISTRIBUTION EXPLAINED WITH EXAMPLE

Поделиться в:

Доступные форматы для скачивания:

Скачать видео mp4

  • Информация по загрузке:

Скачать аудио mp3

Похожие видео

Uniform Distribution Explained with Examples

Uniform Distribution Explained with Examples

Нормальное распределение ОБЪЯСНЕНО с примерами

Нормальное распределение ОБЪЯСНЕНО с примерами

The Normal Distribution and the 68-95-99.7 Rule (5.2)

The Normal Distribution and the 68-95-99.7 Rule (5.2)

Как построить график нормального распределения (колоколообразную кривую) в Excel — с затенением!

Как построить график нормального распределения (колоколообразную кривую) в Excel — с затенением!

Использование Таблицы А для определения процента данных в нормальном распределении

Использование Таблицы А для определения процента данных в нормальном распределении

Standard Normal Distribution Tables, Z Scores, Probability & Empirical Rule  - Stats

Standard Normal Distribution Tables, Z Scores, Probability & Empirical Rule - Stats

The Normal (Gaussian) Distribution - Clearly Explained

The Normal (Gaussian) Distribution - Clearly Explained

Стандартное отклонение (простое объяснение)

Стандартное отклонение (простое объяснение)

LLM и GPT - как работают большие языковые модели? Визуальное введение в трансформеры

LLM и GPT - как работают большие языковые модели? Визуальное введение в трансформеры

Z-оценки, стандартизация и стандартное нормальное распределение (5.3)

Z-оценки, стандартизация и стандартное нормальное распределение (5.3)

Распределение Стьюдента T

Распределение Стьюдента T

Lognormal Distribution - Worked Example

Lognormal Distribution - Worked Example

Finding Areas Under And What Is The Standard Normal Distribution Curve And Z Scores Explained

Finding Areas Under And What Is The Standard Normal Distribution Curve And Z Scores Explained

Распределения выборки (7.2)

Распределения выборки (7.2)

Доверительный интервал [Простое объяснение]

Доверительный интервал [Простое объяснение]

Normal Distribution Series Part 1 - Introduction

Normal Distribution Series Part 1 - Introduction

The Binomial Distribution and Test, Clearly Explained!!!

The Binomial Distribution and Test, Clearly Explained!!!

Для Чего РЕАЛЬНО Нужен был ГОРБ Boeing 747?

Для Чего РЕАЛЬНО Нужен был ГОРБ Boeing 747?

Как Россия учится летать на старых самолетах

Как Россия учится летать на старых самолетах

Learn how to create a normal distribution curve given mean and standard deviation

Learn how to create a normal distribution curve given mean and standard deviation

© 2025 dtub. Все права защищены.


  • Контакты
  • О нас
  • Политика конфиденциальности


Контакты для правообладателей: infodtube@gmail.com