Популярное

Музыка Кино и Анимация Автомобили Животные Спорт Путешествия Игры Юмор

Интересные видео

2025 Сериалы Трейлеры Новости Как сделать Видеоуроки Diy своими руками

Топ запросов

смотреть а4 schoolboy runaway турецкий сериал смотреть мультфильмы эдисон
dTub
Скачать

How to make heatplot in Stata | Correlation Heat plot

Автор: The Data Hall

Загружено: 2021-09-26

Просмотров: 8422

Описание:

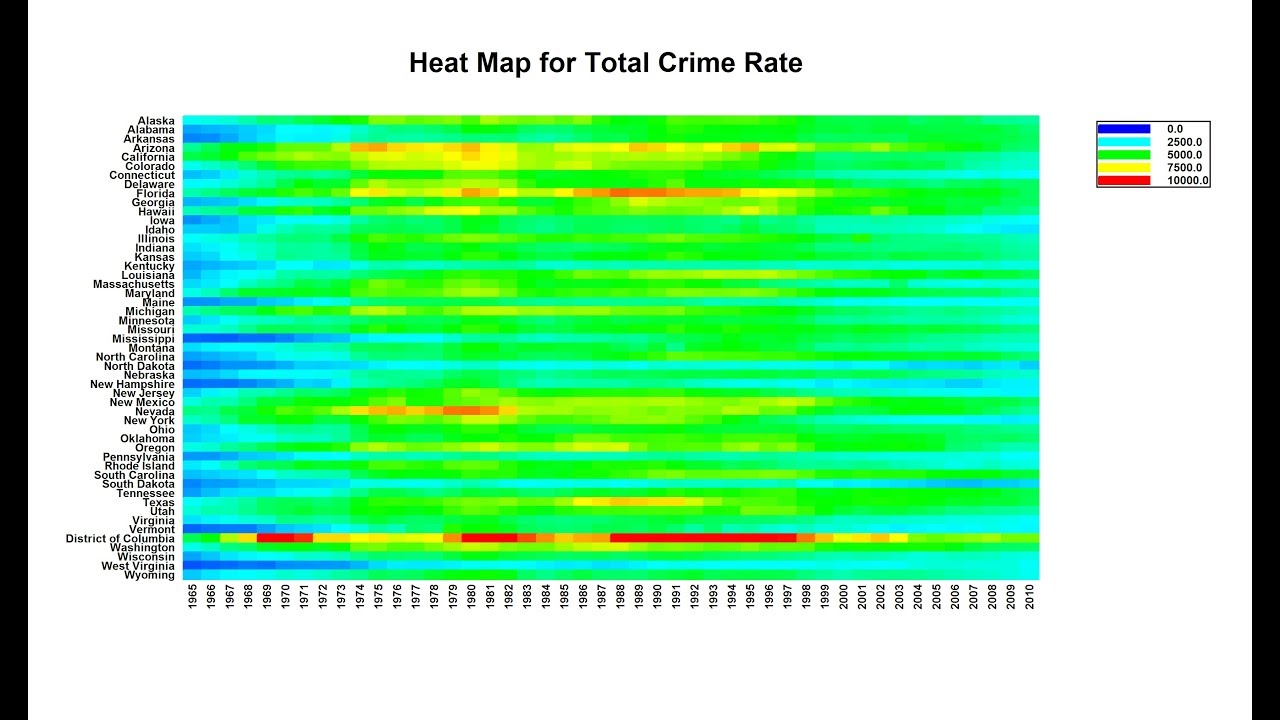
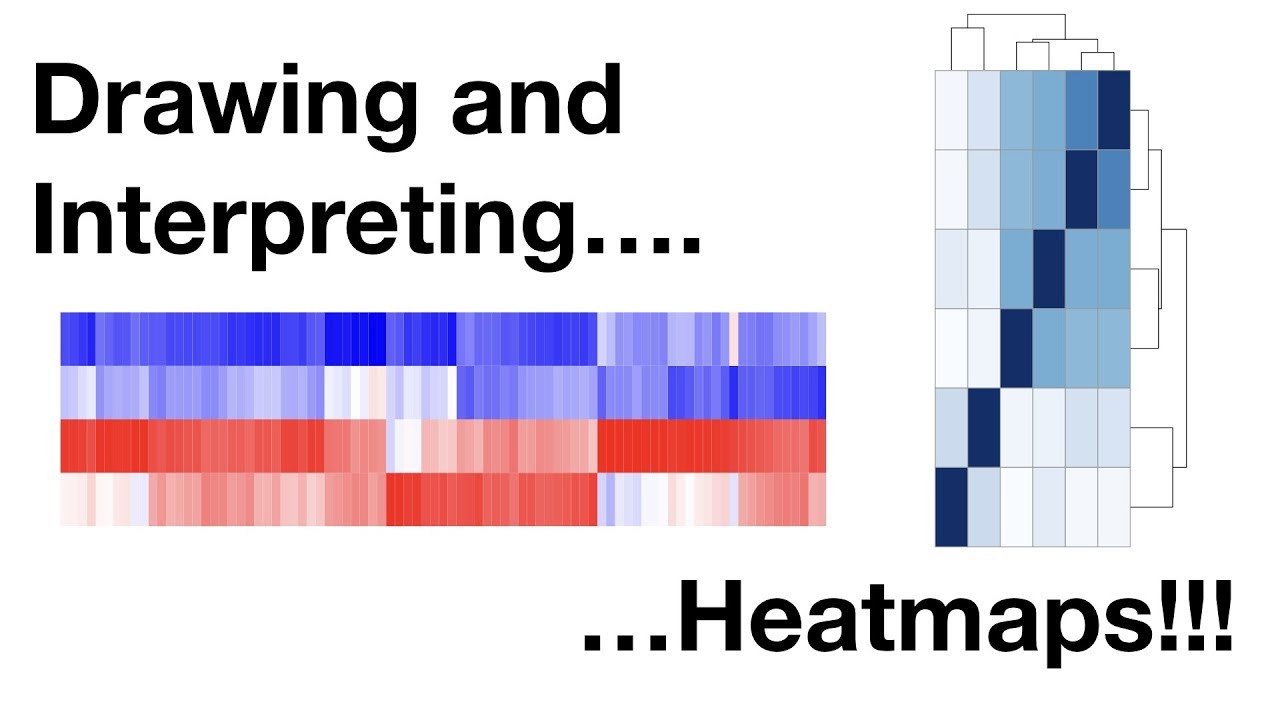
Visual presentation of correalation makes it easy for reader to drawy meaning. Heatpolot command is used to creat correlation heatplot in stata.

Following link contains the files used in the video:
https://payhip.com/b/5XGfc

Following link contains more information on this topic:
https://thedatahall.com/how-to-make-h...

Best 10 Introductory Econometrics Books
https://thedatahall.com/best-10-intro...

Econometric Analysis of Cross Section and Panel Data by Jeffrey M. Wooldridge
https://amzn.to/4220RUA

Introductory Econometrics for Finance by Chris Brooks
https://amzn.to/3HwmOmM

An Introduction to Modern Econometrics Using Stata by Christopher F. Baum
https://amzn.to/42prKBT

Microeconometrics Using Stata by A. Colin Cameron and Pravin K. Trivedi
https://amzn.to/42ra88r

Website: thedatahall.com

Disclaimer: Some links are affiliate links that help the channel at no cost to you.

How to make heatplot in Stata | Correlation Heat plot

Поделиться в:

Доступные форматы для скачивания:

Скачать видео mp4

  • Информация по загрузке:

Скачать аудио mp3

Похожие видео

Creating Correlograms (correlation plots) in Minitab 21

Creating Correlograms (correlation plots) in Minitab 21

Как создать тепловую карту в Excel (ЛЕГКИЙ СПОСОБ)

Как создать тепловую карту в Excel (ЛЕГКИЙ СПОСОБ)

Как интерпретировать тепловую карту для анализа дифференциальной экспрессии генов — простое объяс...

Как интерпретировать тепловую карту для анализа дифференциальной экспрессии генов — простое объяс...

Margins and Margins Plot in Stata

Margins and Margins Plot in Stata

STATA4: Pairwise Correlation Matrix in STATA #dataanalysis #paneldata #correlation #stata

STATA4: Pairwise Correlation Matrix in STATA #dataanalysis #paneldata #correlation #stata

Visualization of correlation matrix in R | ggcorrplot tutorial | ggplot2 extension | R Tutorial

Visualization of correlation matrix in R | ggcorrplot tutorial | ggplot2 extension | R Tutorial

Матрица корреляции Пирсона с p-значениями в R

Матрица корреляции Пирсона с p-значениями в R

iMeta | Zuguang Gu. 2022. Complex heatmap visualization

iMeta | Zuguang Gu. 2022. Complex heatmap visualization

Heatmaps in R | 4 different ways to make heatmaps in R

Heatmaps in R | 4 different ways to make heatmaps in R

002. Создайте интерактивную карту с диаграммами за 10 минут! | EXCEL

002. Создайте интерактивную карту с диаграммами за 10 минут! | EXCEL

Выучите R за 39 минут

Выучите R за 39 минут

Heat Maps

Heat Maps

How to draw panel data graphs in stata.

How to draw panel data graphs in stata.

Drawing and Interpreting Heatmaps

Drawing and Interpreting Heatmaps

System Design Concepts Course and Interview Prep

System Design Concepts Course and Interview Prep

Three Way Interaction in R | The Data Hall

Three Way Interaction in R | The Data Hall

LLM и GPT - как работают большие языковые модели? Визуальное введение в трансформеры

LLM и GPT - как работают большие языковые модели? Визуальное введение в трансформеры

Create maps in Stata with spmap

Create maps in Stata with spmap

Post estimation tests of Panel data using Stata: VIF: Serial Correlation: heteroskedasticity

Post estimation tests of Panel data using Stata: VIF: Serial Correlation: heteroskedasticity

Contour plots in Stata®

Contour plots in Stata®

© 2025 dtub. Все права защищены.


  • Контакты
  • О нас
  • Политика конфиденциальности


Контакты для правообладателей: infodtube@gmail.com