Illustrated Excel 365/2021 Modules 1-4: SAM Capstone Project 1a | IL EX365 2021 CS1 4a
Автор: Lee Stewart
Загружено: 2025-10-24
Просмотров: 57
IL EX365 2021 CS1 4a | Illustrated Excel 365/2021 Modules 1-4: SAM Capstone Project 1a
Contact Us
Whatsapp NO : +994-401583314
IL EX365 2021 CS1 4a
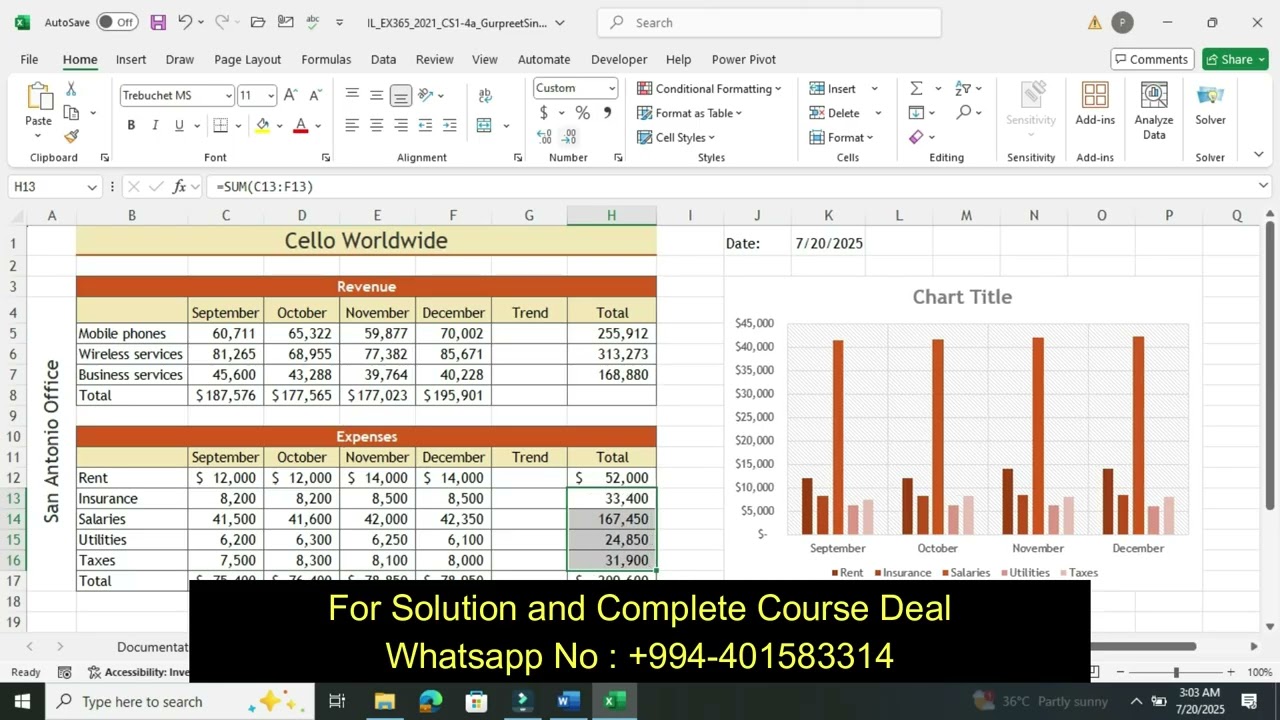
1. Kamal Haman directs the San Antonio office of Cello Worldwide, a global communications company. He has been tracking revenues and expenses along with customer data in an Excel workbook, including charts to help him visualize the data. He has asked you to help him complete the workbook and insert additional charts.
Go to the Revenue & Expenses worksheet. In cell K1, insert a formula using the TODAY function to display today's date.
2. Fill the range D4:F4 with a series based on the value in cell C4 to provide the missing month names.
3. Format the text in cell A4 as follows to make it readable and more meaningful:
a. Merge and center the contents of the range A4:A17.
b. Rotate the text in the merged cell up to 90 degrees so it reads from bottom to top.
c. Middle-align the merged cell.
d. Resize column A to a width of 6.00.
4. Use AutoFit to resize column B to its best fit to display all the revenue and expense types.
5. Complete the calculations for the Revenue data as follows:
a. In cell C7, enter 45,600 as the Business services revenue for September.
b. In cell C8, use the SUM function to total the September Revenue values.
c. Copy the formula in cell C8 to the range D8:F8 and to cell H8 to complete the totals.
6. Format the nonadjacent ranges C13:F16 and H13:H16 using Comma style and no decimal places to match the formatting of the Revenue data.
7. Kamal wants to display the highest and lowest revenue amounts from September to December. Enter and format this information as follows:
a. In cell C24, enter a formula using the MIN function to display the lowest revenue in the range C5:F7.
b. In cell C25, enter a formula using the MAX function to display the highest revenue in the range C5:F7.
c. Apply Outside Borders to the range B24:C25 using Black, Text 1, Lighter 35% as the border color to show the information belongs together.
8. In the clustered column chart in the range J3:P17, Kamal wants to show the expenses by type, not by month. He also wants to make the contents of the chart clearer. Provide this information for him as follows:
a. Switch the rows and columns to display expenses by type.
b. Move the legend to the right side of the chart.
c. Add Monthly Amount as the primary vertical axis title.
d. Add Expenses by Type as the chart title.
e. Change the fill color of the December data series to Dark Red, Accent 1.
f. Add a chart border using the Black, Text 1, Lighter 50% shape outline color.
9. Kamal wants to include a chart showing the monthly profits for the San Antonio office to determine which months have been more favorable. Create a new chart as follows:
a. Create a doughnut chart based on the range C21:F22.
b. Resize and reposition the chart so that its upper-left corner is within cell J19 and its lower-right corner is within cell P31.
c. Enter Sept to Dec Profit as the chart title.
d. Apply Layout 6 to the chart to display percentages on each part of the doughnut.
10. Kamal also wants to include a chart showing the revenue earned from mobile phones, wireless services, and business services. Create and format a chart for him as follows:
a. Create a Stacked Column chart based on the range B4:F7.
b. Move the chart to a new sheet named Revenue Chart.
c. Change the chart style to Style 7 to match the style of the clustered column chart on the Revenue & Expenses worksheet.
d. Change the font size of all the chart text to 14 point to make it easier to read.
e. Remove the chart title since the sheet tab indicates the purpose of the chart.
11. Clarify the data in the chart as follows:
a. Format the values in the vertical axis using the Accounting number format with no decimal places to clarify the values are dollar amounts.
b. Add a data table with legend keys to the chart to display the revenue values.
c. Remove the legend, which is now redundant.
12. Kamal wants to track the trends for each type of revenue and expense and for the profit analysis. Provide this information for him as follows:
a. Go to the Revenue & Expenses worksheet. In cell G5, insert a Line sparkline based on the data in the range C5:F5.
b. Include markers in the sparkline, and then change the marker color to Black, Text 1.
c. Copy cell G5, and then paste it in the range G6:G8, the range G12:G17, and cell G22.
13. Go to the Business Customer Analysis worksheet, which compiles data about the Texas business accounts that Kamal handles. Calculate the number of years a customer has been with Cello Worldwide as follows:
Доступные форматы для скачивания:
Скачать видео mp4
-
Информация по загрузке:


