Tableau Tutorial for Beginners - Rank over time - bump chart, slope chart, connected scatter plot
Автор: sqlbelle
Загружено: 2023-03-12
Просмотров: 7333
Bar chart, bump chart, slope chart, connected scatter plot - these are some of the charts we can use to show changes in rank over time. In addition, learn more about the following Tableau features in this walkthrough, specifically
quick table calculation for ranking
data highlighter
adjusting the options for labelling
dual axis chart
additional table calculation functions for finding first and last points
Chapters
00:06 - Setup
01:05 - Bar Chart - variation 1
03:27 - Bar Chart - variation 2
06:35 - Bump Chart
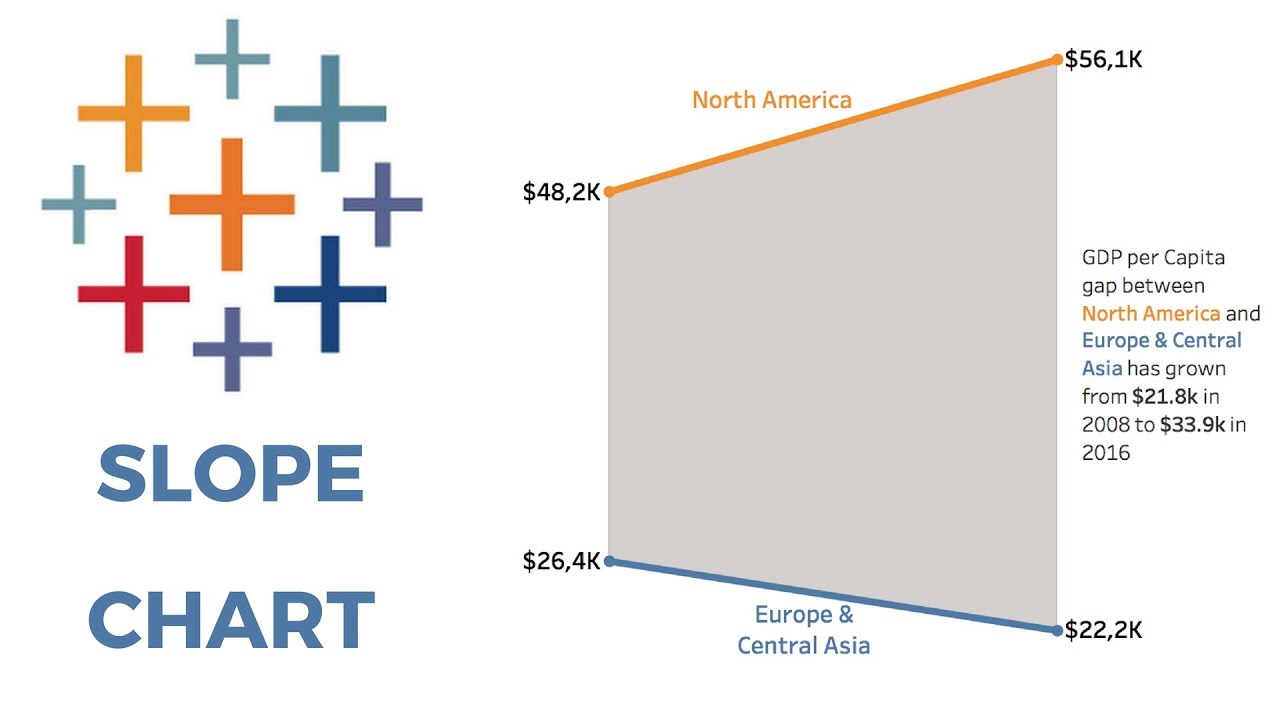
12:40 - Slope Chart
15:34 - Connected Scatter Plot
Additional Tutorials
Level Up Tableau
• Tableau - LEVEL UP your problem solving wi...
Table Calculations
• Tableau Table Calculations Explained - Com...
Level of Detail (LOD) Expressions
• Tableau LOD (Level of Detail) Expressions ...
Calculations Playlist
• Tableau Calculations? Follow this playlist
Sets and Set Actions
• Tableau Sets and Set Actions Comprehensive...
Top 1-5 LOD Expressions
• Tableau Tutorial - Top 1-5 LOD Expressions...
Dates
• Tableau Dates: Complete Introduction -Date...
Filters
• Tableau Filters - Comprehensive Tutorial i...
Sample Certification Exam Questions
• Tableau Certification Exam Tips / Hands On...

Доступные форматы для скачивания:
Скачать видео mp4
-
Информация по загрузке:


![Неожиданная правда о 4 миллиардах лет эволюции [Veritasium]](https://imager.clipsaver.ru/Unxh6MnVIWc/max.jpg)