Скачать
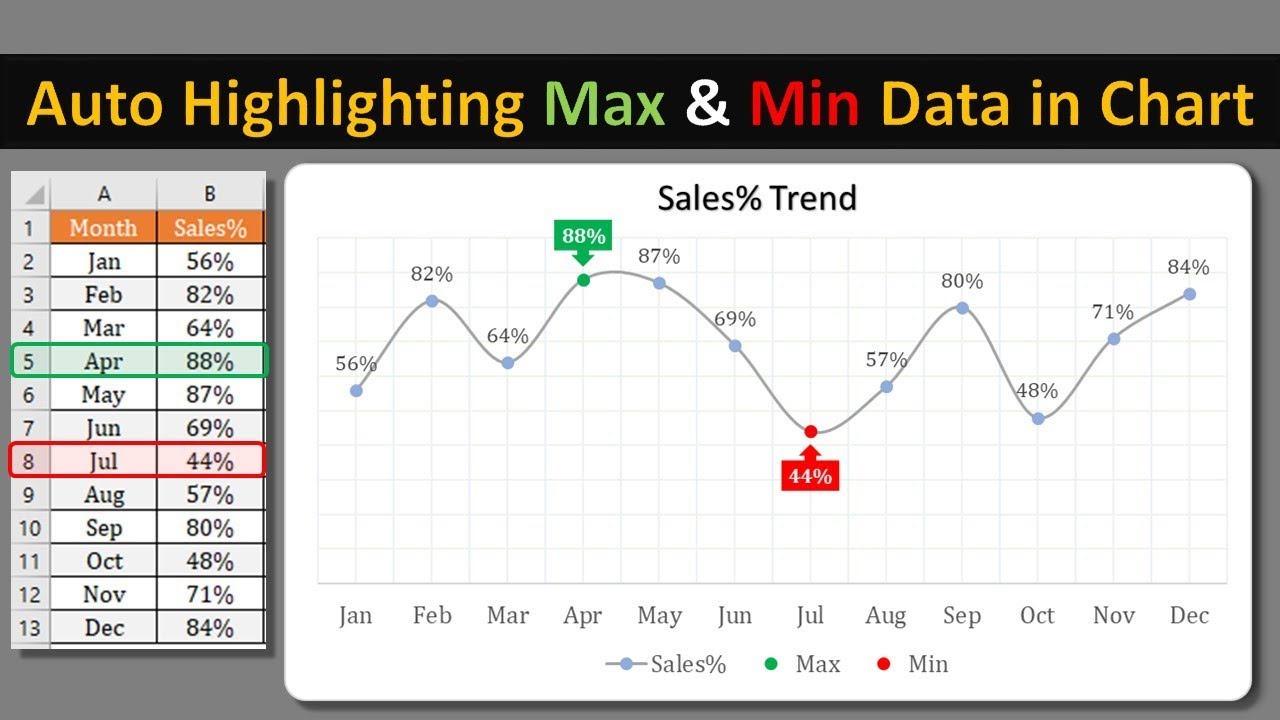
Highlighting Max and Min Data Points in Chart Dynamically
Автор: TheDataLabs
Загружено: 2019-04-29
Просмотров: 8762
Описание:
Highlighting Maximum and Minimum Data Points in Excel Chart
In this video, we will learn how to highlight max and min data points in chart. We will use the line chart to do this however, you can use the same technique to highlight it in any of the chart type available in MS Excel.
#DynamicChart
#Highlight_Max_Min_Data_In_Chart
Please follow the below link to download the file used in this video.
https://thedatalabs.org/highlight-max...
Please visit on our website for similar contents, automated tools and dashboard.
Thanks for watching!
Please like, share, comment and subscribe.
Have a good day!
Доступные форматы для скачивания:
Скачать видео mp4
-
Информация по загрузке: