Скачать
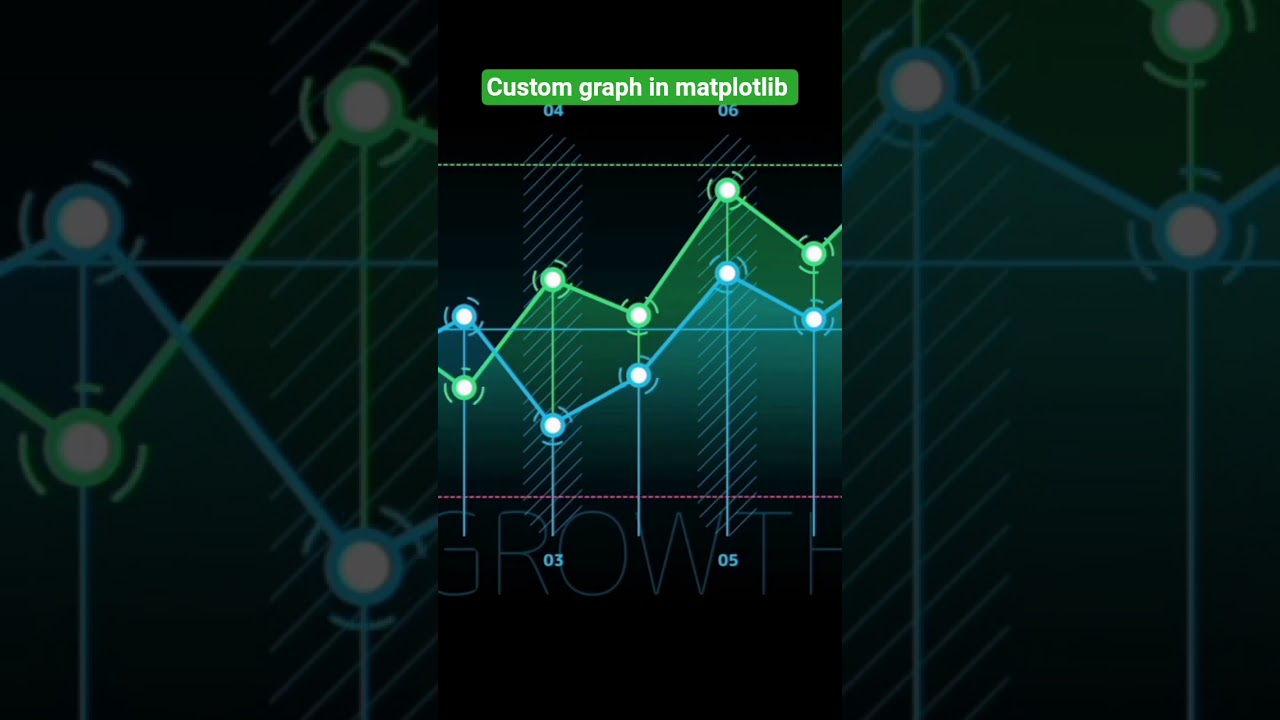
Part148 custom graph in matplotlib
Автор: Python and AI ML Data Science
Загружено: 2025-09-22
Просмотров: 9
Описание:
Want to design custom graphs tailored to your data using Matplotlib? 🐍🎨 In this quick #Shorts tutorial, I’ll show you how to customize your plots — from colors and labels to styles and layouts — making your visualizations truly unique! ✨
What you’ll learn in under 60 seconds:
How to change colors, line styles, and markers
How to add titles, labels, and legends
Tips for customizing your graph layout for better clarity
Perfect for Python beginners, data analysts, and anyone who wants their charts to stand out in reports or presentations!
Доступные форматы для скачивания:
Скачать видео mp4
-
Информация по загрузке: