R code for Big Data: New Tricks for Econometrics
Автор: Brian Byrne
Загружено: 2021-02-26
Просмотров: 448
https://sites.google.com/view/vinegar...
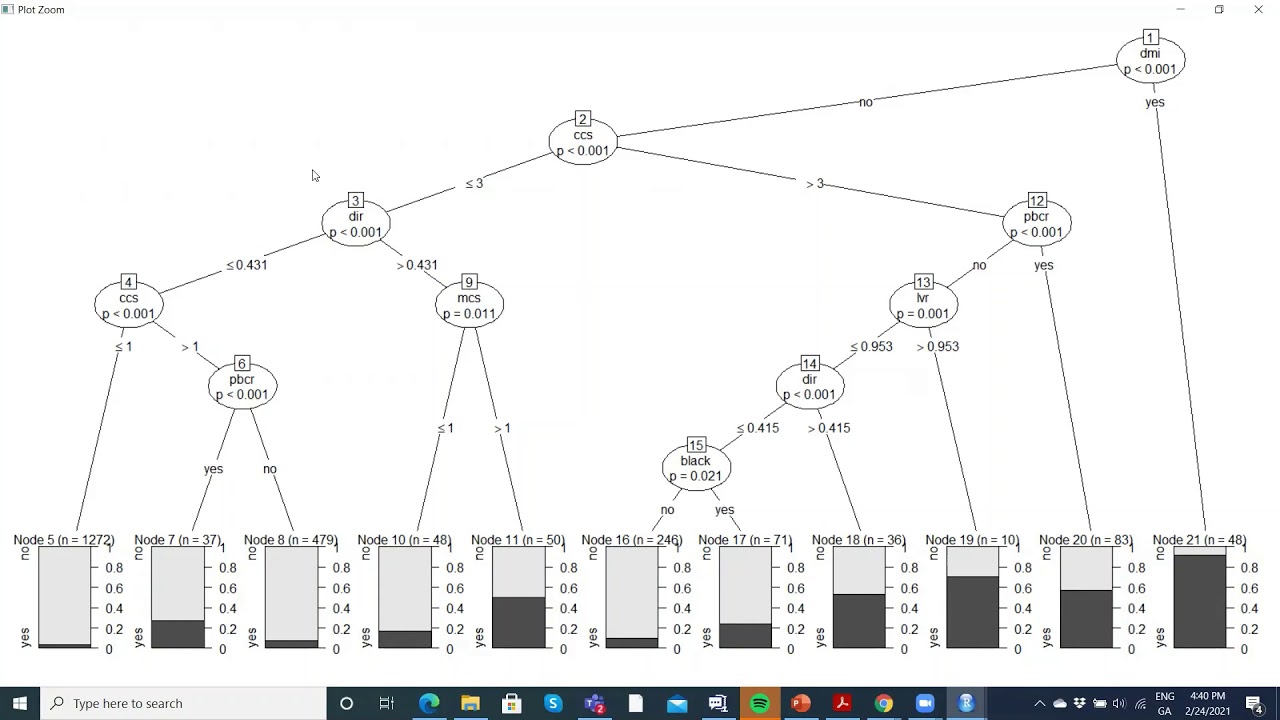
The Munnell et al (1996) HMDA Machine Learning with ctree, Logit Modelling and Random Forest
Varian (2014) uses the following snippets of R Script and compares the relative performance of each of the following approaches: (1) cTree (2) Logit (3) RandomForests
Decision trees often present with the problem of variable selection bias and overfitting. One of more recent algorithms developed to mitigate this problem is relates to the self - pruning embedded in Conditional Inference Trees (CTREE), created by Hothorn, Hornik, and Zeileis (2006). The CTREE algorithm is considered unbiased because it selects the predictors through a "... global null hypothesis of independence between any of the m covariates and the response" (Hothorn et al., 2006, p. 2), followed by using statistical hypothesis testing and their p-values to inspect and choose the best predictors used in each split of the data and, in this way, build the tree. According to the authors: "If the global hypothesis can be rejected, we measure the association between Y and each of the covariates Xj, j = 1, . . . , m, by test statistics or P-values indicating the deviation from the partial hypotheses." (Hothorn et al., 2006, p. 3).
Logistic Regression provides a more traditional framework for solving classification problems. An intuitive explanation is provided here.
Random Forests generate many classification trees. To classify a new object from an input vector, we run that vector through each tree in the forest. Each tree leans towards a classification or exercises a vote. Majority vote wins. Alternatively, average wins when not pursuing classification. Random forest introduces additional randomness when growing the trees. Rather that unearth the most important feature while splitting branches, random forests probe to discover the best feature contained within a random subset of features. This yields greater diversity. When using the HMDA Boston data, the ctree mis-classifies 228 of the 2,380 observations - producing an error rate of 9.6 percent. In comparison, a straight logit model does somewhat better, mis-classifying 225 when predicting, producing an error rate of 9.5 percent. The random forest method mis-classified 223 of the 2,380 cases. Overall, the Random Forest approach produced a marginally better performance relative to the ctree.
Доступные форматы для скачивания:
Скачать видео mp4
-
Информация по загрузке:


![Как сжимаются изображения? [46 МБ ↘↘ 4,07 МБ] JPEG в деталях](https://image.4k-video.ru/id-video/Kv1Hiv3ox8I)


