Your Industrial IoT Dashboards Monitor Water Usage & Flow Meters - Real-Time Well Sensor Telemetry
Автор: Valarm
Загружено: 2017-02-02
Просмотров: 3818
http://Tools.Valarm.net with Industrial IoT Dashboards to Effectively Monitor Your Water. Talk To Us at Info@Valarm.net and we'll help your organization remotely monitor anything, anywhere!
http://www.Valarm.net has even more info than you can shake a stick at!
Voiceover / Transcript:
Howdy! This is Edward from Valarm.
In this video you’ll see how our customers use Industrial Internet of Things, a.k.a., IoT, sensors to remotely monitor water, air, tanks, equipment, assets, and anything that’s important for your organization.
Valarm dashboards use the Tools.Valarm.net APIs to show real-time sensor information on custom web dashboards. We made each of these dashboards according to our customer’s specific needs and continue to improve them as the customer requests. Please don’t hesitate to contact us at Info@Valarm.net and we’ll help you with your remote monitoring needs.
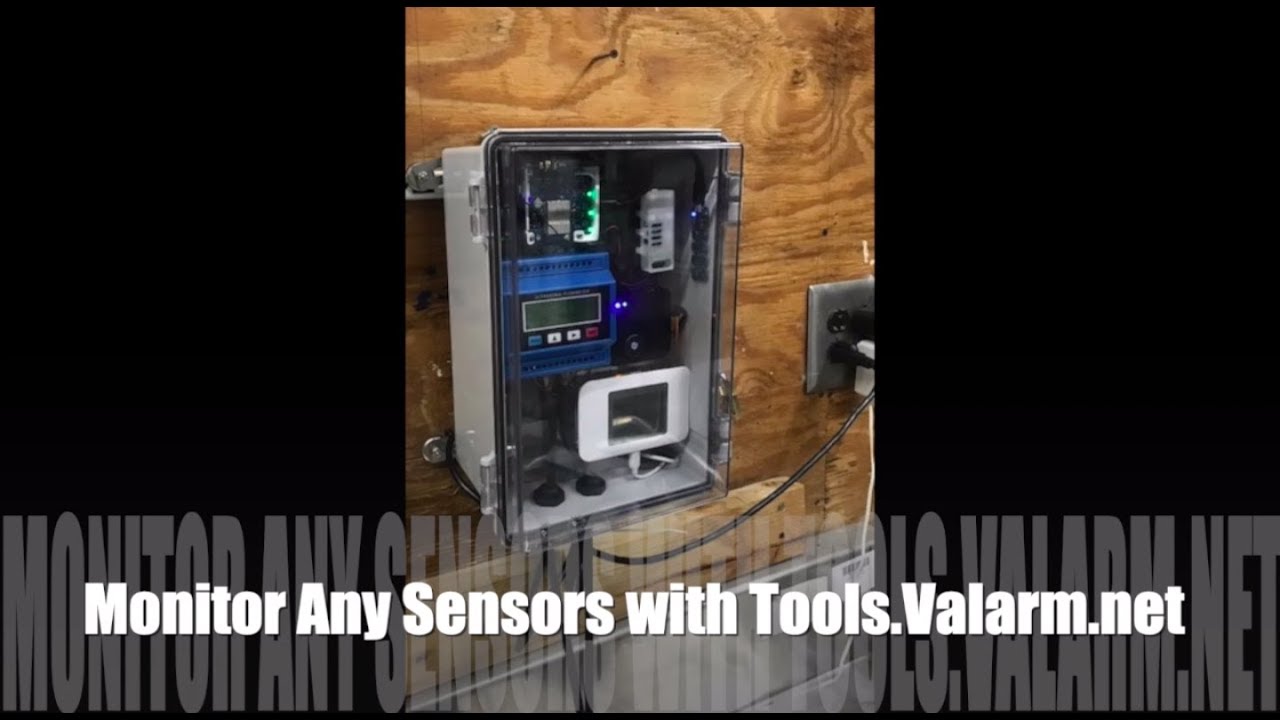
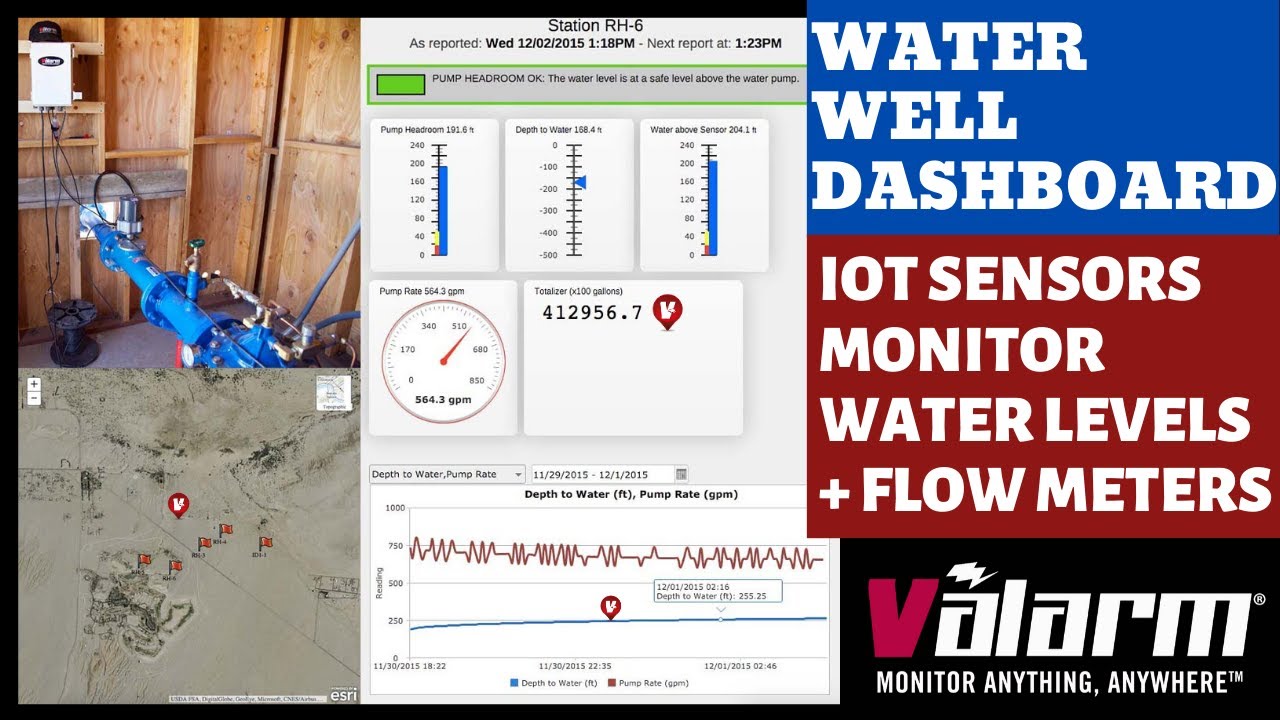
Let’s take a gander at dashboards for remotely monitoring water wells. Once you log in you see an Esri map with all of the water well locations being monitored. You can see what the water wells and remote monitoring units look like in the photo. In this case, the water wells have an In-Situ pressure transducers and McCrometer flowmeters. ( http://www.in-situ.com & http://www.mccrometer.com )
These units use long-range WiFi or wireless internet and standard mains 110V power to send sensor information to http://Tools.Valarm.net . Since http://Tools.Valarm.net is an open platform, you can use sensors made by any manufacturer around the world.
You can click to see further details about each water well. At the top you see the water well name and the last reported date & time plus the next report. You can customize this as you need.
You can add any custom calculations, sections, and widgets you need for your remote monitoring applications. There’s a green section at the top telling you that the pump head room is ok and that the water level is at a safe level above the water pump.
You’ll see widgets and graphics showing you the latest on your water levels. From the left to right in this example you’ve got the latest pump headroom, depth to water, water above sensor, pump rate in gallons per minute, and a totalizer / running total in gallons.
You also see graphs where you can select any of your sensor variables to plot. In this example you’re seeing depth to water and pump rate in the graph. You can choose the time range that you want to see, whether it’s the last 3 days, week, or month.
Mousing over a sensor in the line graph pops up a widget that shows you the sensor value at that time. For example here you’ll see the water well pump rate in gallons per minute or gpm. And you’re also seeing the depth to water. You can clearly see the real-time relationship between the water well levels and the pump rate. And then once the pump is turned off you can see the aquifer health, depths, and levels recharging.
That’s a quick overview of a Valarm dashboard. Is your organization ready for 1 of these? Please don’t hesitate to Contact Us at Info@Valarm.net. Whether you need to monitor air quality, water, pollution, industrial fleet vehicles, trucks, trailers, industrial equipment, assets, or anything else, we’re here to help your organization deploy your most effective remote monitoring system solutions. And thank you for watching!
Доступные форматы для скачивания:
Скачать видео mp4
-
Информация по загрузке: