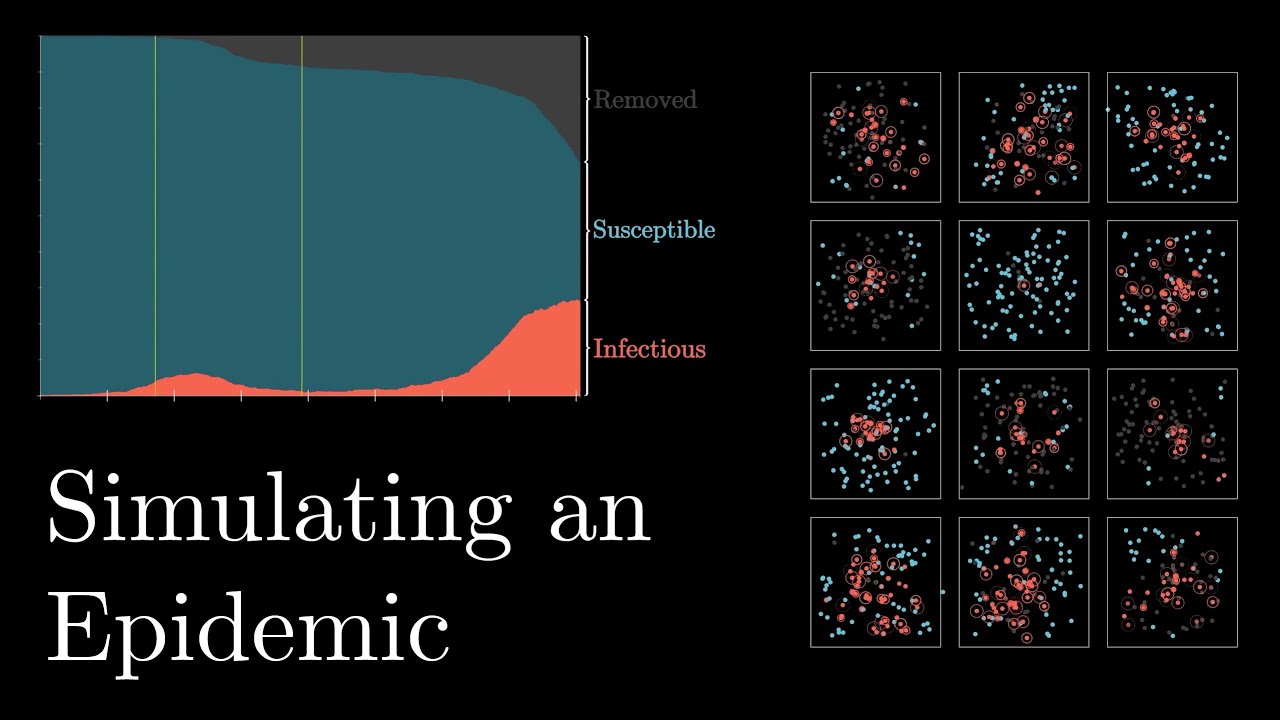
Model COVID-19 using MATLAB (Full code in description) | Modeling the Pandemic, code 1
Автор: Nadanomics
Загружено: 2020-03-12
Просмотров: 18915
The code in the video needs to be corrected. I made a wrong SEIRD model, as the death rate needs to be applied as a probability, not an outflow rate.
The correct code is as follows:
**ODE function (In Matlab, the name of the function needs to be the same as the name of the script. Save this as ode_fun_simple.m):
function dydt = ode_fun_simple(t, y,beta)
Death = 0.034; % Death rate of COVID-19 (March, 2020)
Pre_infec = 5.2;
f = 1/Pre_infec;
Duration = 14;
r = 1/Duration;
S = y(1);
E= y(2);
I = y(3);
dS = -beta*I.*S;
dE = beta*I.*S - f.*E;
dI = f*E - r*I;
dR = r*(1-Death)*I;
dD = (Death)*r*I;
dydt = [dS; dE; dI; dR; dD];
end
============================================================
Running without the policy
============================================================
clear all; clc;
%% Parameters
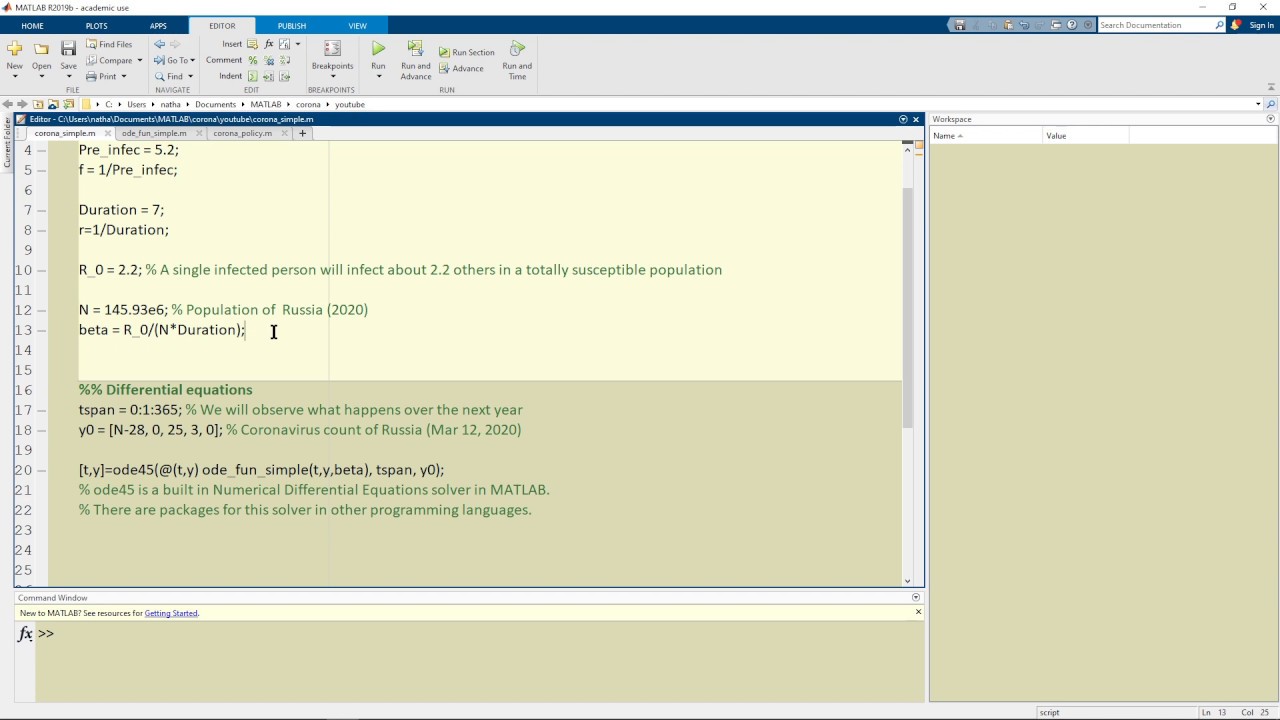
Pre_infec = 5.2;
f = 1/Pre_infec;
Duration = 7;
r=1/Duration;
R_0 = 2.2; % A single infected person will infect about 2.2 others in a totally susceptible population
N = 145.93e6; % Population of Russia (2020)
beta = R_0/(N*Duration);
%% Differential equations
tspan = 0:1:365; % We will observe what happens over the next year
y0 = [N-28, 0, 25, 3, 0]; % Coronavirus count of Russia (Mar 12, 2020)
[t,y]=ode45(@(t,y) ode_fun_simple(t,y,beta), tspan, y0);
% ode45 is a built in Numerical Differential Equations solver in MATLAB.
% There are packages for this solver in other programming languages.
%% plot
plot(t,y,'LineWidth', 1.5, 'MarkerSize', 18)
legend('Susceptible','Pre-Infectious','Infectious','Recovered','Death', 'Location', 'Best')
xlabel('Days after March 12, 2020')
ylabel('Population')
title('Predicted Spread of COVID-19 in Russia')
grid on;
grid minor;
set(gca, 'FontSize', 26)
%saveas(gcf, 'corona_simple1.png')
============================================================
Running with the policy
============================================================
clear all;
%% Parameters
Pre_infec = 5.2;
f = 1/Pre_infec;
Duration = 7;
r=1/Duration;
R_0 = 2.2; % A single infected person will infect about 2.2 others in a totally susceptible population
N = 145.93e6; % Population of Russia (2020)
beta = R_0/(N*Duration);
%% Differential equations
%Change me
tspan1 = 0:1:120; % Before policy
y0 = [N-28, 0, 25, 3,0]; % Coronavirus count of Russia (Mar 12, 2020)
[t,y]=ode45(@(t,y) ode_fun_simple(t,y,beta), tspan1, y0);
% ode45 is a built in Numerical Differential Equations solver in MATLAB.
% There are packages for this solver in other programming languages.
y_2nd = [y(end,1), y(end,2), y(end,3), y(end,4), y(end,5)];
%Change me
tspan2 = 121:1:365;
[t,y2]=ode45(@(t,y) ode_fun_simple(t, y, beta/2), tspan2, y_2nd);
y_combined = [y;y2];
%%
plot(0:1:365,y_combined,'LineWidth', 1.5, 'MarkerSize', 18)
legend('S','E','I','R','D', 'Location', 'Best')
xlabel('Days after March 12, 2020')
ylabel('Population')
title('Predicted Spread of COVID-19 in Russia')
grid on;
grid minor;
set(gca, 'FontSize', 26)
%saveas(gcf, 'corona_120dayPolicy.png')
Доступные форматы для скачивания:
Скачать видео mp4
-
Информация по загрузке: