Different Types of Plots in R with ggplot2 | Batch86 Complete Guide for Beginners
Автор: Data Analysis &Visualization: R & Python Tutorials
Загружено: 2025-06-17
Просмотров: 60
Master data visualization in R with this Batch86 tutorial on creating different types of plots using ggplot2! This beginner-friendly video will walk you through the most common and useful plots in R using the powerful ggplot2 package.
📌 What You’ll Learn:
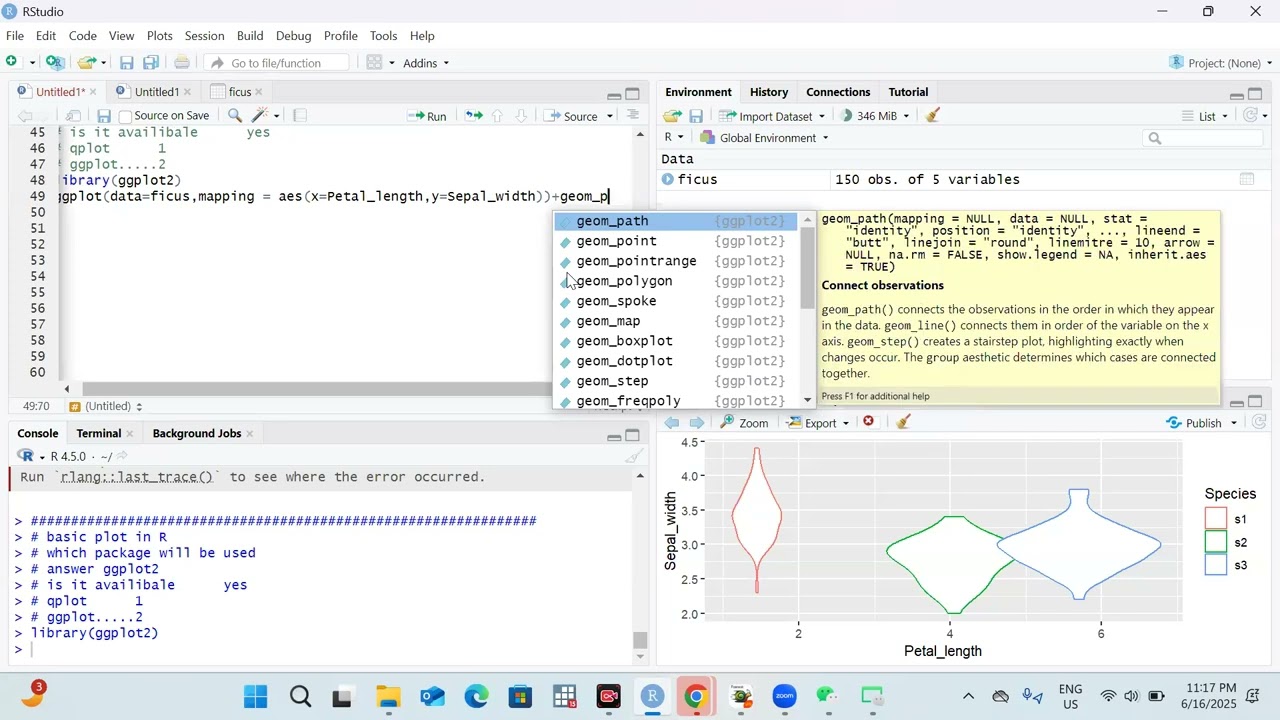
Bar plot, Line plot, Scatter plot
Histogram, Boxplot, Density plot
Violin plot, Dot plot, Area chart, and more!
How to customize themes, colors, labels, and legends
Practical examples with clean, step-by-step coding
🔧 Tools used: ggplot2, dplyr
👉 Ideal for students, researchers, data scientists, and anyone starting with R programming.
🎯 BONUS: Tips on making your plots publication-ready!
📎 R Script & Dataset Download: (Insert link here)
🎓 More tutorials: [Insert your playlist or website link]
#RPlots #ggplot2 #DataVisualization #RProgramming #Batch86
Доступные форматы для скачивания:
Скачать видео mp4
-
Информация по загрузке: