Lesson 2: Understanding the ROS 2 Graph — From Playback to Perception
Автор: S1S2 Robotics Academy
Загружено: 2026-01-18
Просмотров: 4
This video is part of the mini course Robot Vision: ROSifying a YOLO Pipeline: https://cm.s1s2.ai/spaces/21840388/
In this lesson, we explore one of the most powerful ideas in ROS 2: the computational graph. You’ll see how data flows between nodes through topics, and how we can use tools like rosbag, RViz, and rqt_graph to visualize and understand that flow.
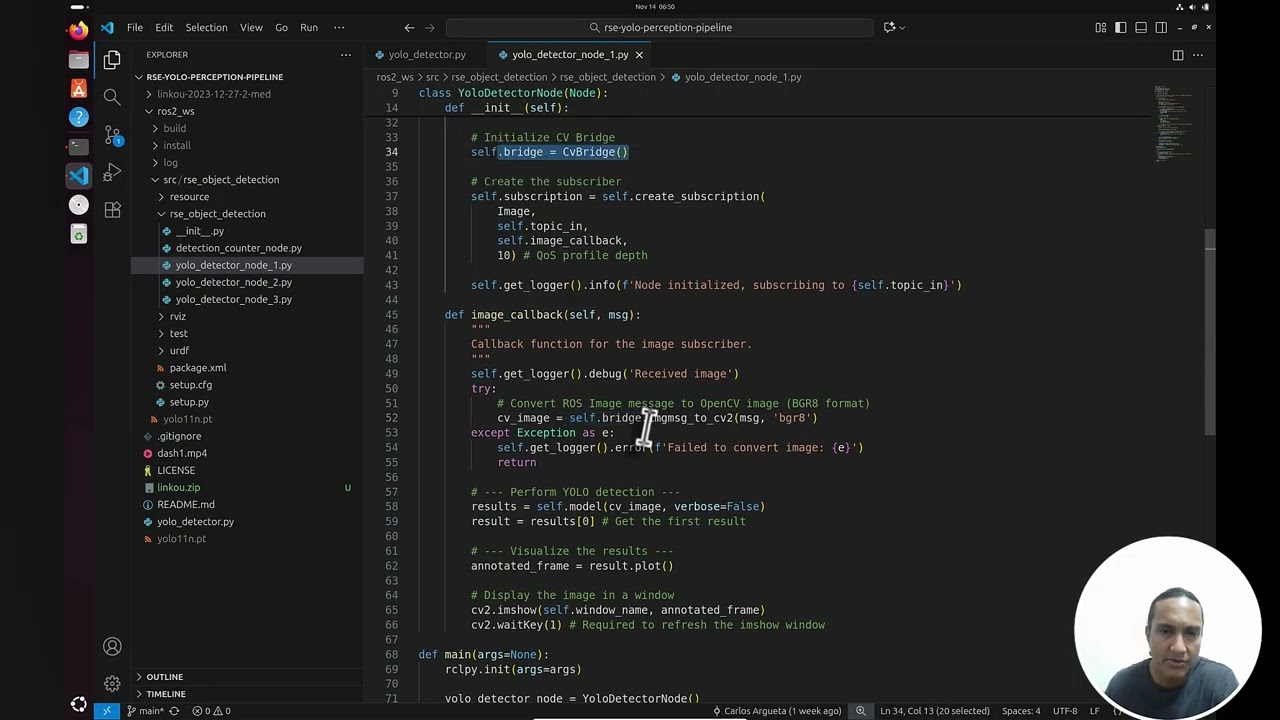
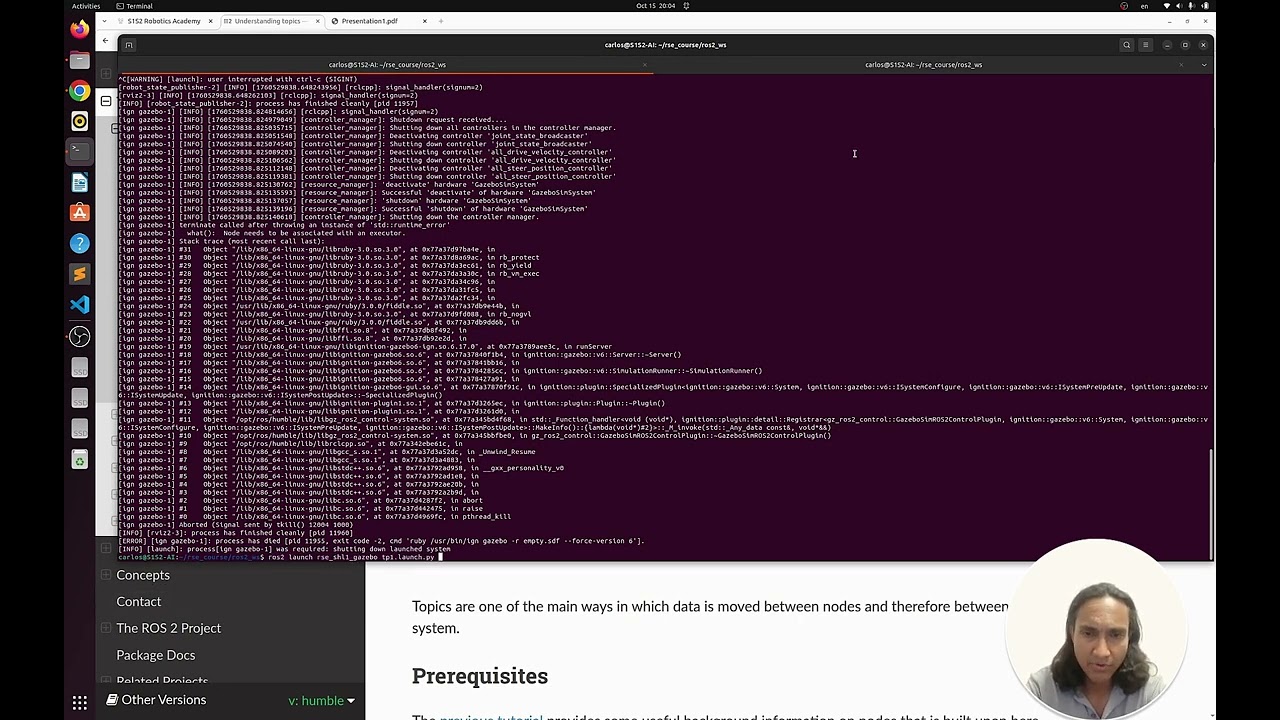
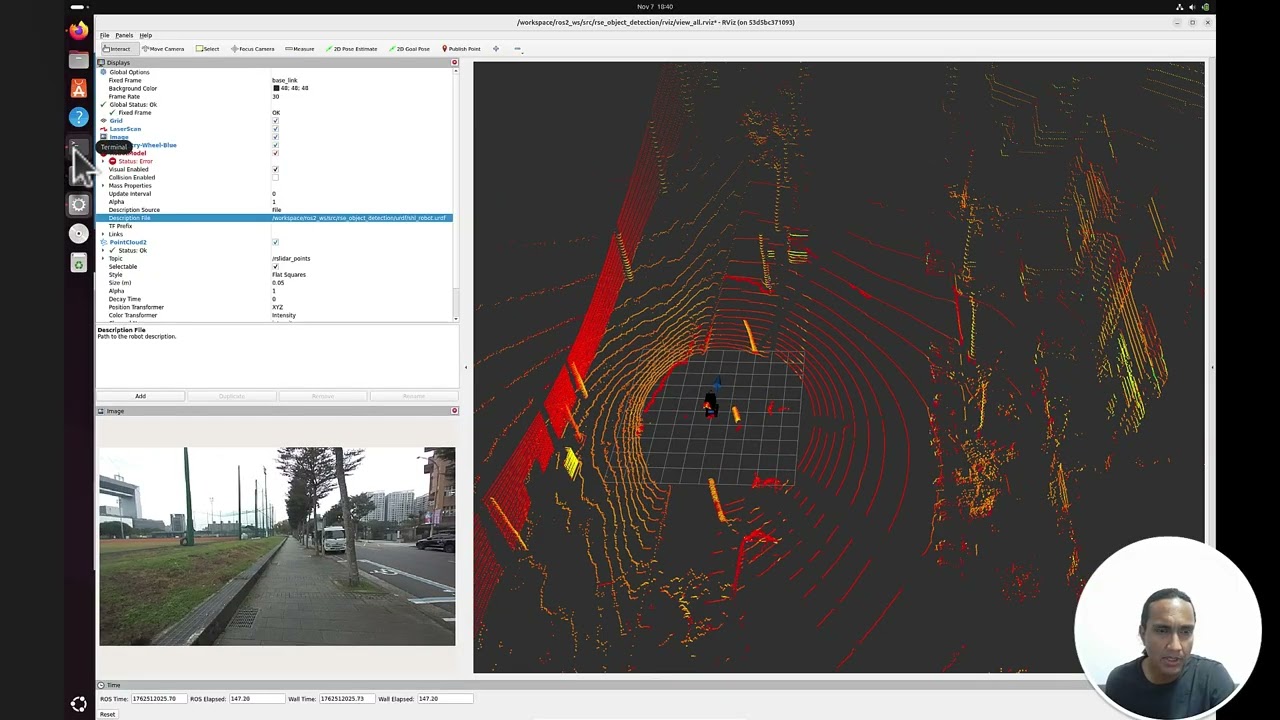
We’ll begin by replaying a rosbag to simulate sensor data — showing how even recorded data behaves like a live publisher in ROS 2. Then, we’ll view this data in RViz, inspect how nodes connect through topics in rqt_graph, and finally introduce our first version of the YOLO detection node. This node will subscribe to camera data and display its detections in real time, laying the foundation for our full vision pipeline.
Доступные форматы для скачивания:
Скачать видео mp4
-
Информация по загрузке: