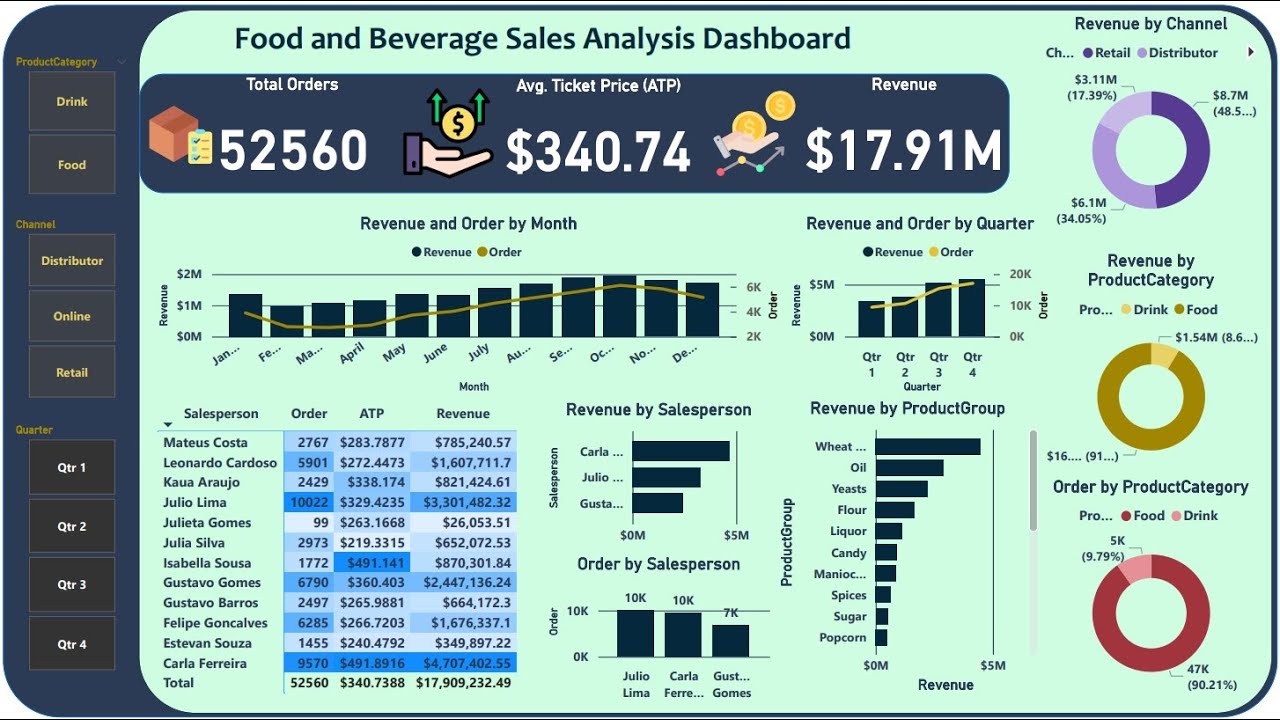
Food & Beverage Sale Analysis Dashboard in Power BI | Learn Power BI in 30 Mins from basic |
Автор: The Data Science Studio
Загружено: 2023-01-15
Просмотров: 42359
#businessintelligence #microsoftpowerbi #powerbi #dataanalysis #dataanalytics
Hello Friends !!!
Microsoft’s Power BI is a business and data analytics service that enables professionals to process, analyze, and visualize vast volumes of data. It helps extract insights, draw conclusions, and share results in the form of reports and dashboards across various departments. It provides an easy drag and drops feature with a range of interactive data visualizations to generate reports and dashboards.
**Features of Power BI**1. Power BI is faster and performs better when there is a smaller volume of data.2. Power BI provides an interface based on Microsoft Office 365 that is user-friendly, intuitive, and easy to understand.3. Using Power BI, you can work with several data sources, such as Excel, Text/CSV, JSON, SQL Server databases, IBM DB2, MySQL, etc.4. Power BI can connect with the R programming language, and it also supports various Data Analysis Expression (DAX) functions and measuresPower BI has functional integration with the Microsoft Azure cloud platform. 5. It helps to analyze insights and patterns in datasets.
**What is a Power BI Dashboard?
Power BI dashboards are single-page documents, often referred to as canvas, which illustrate a story through visualizations. A well-designed dashboard consists only of the highlights of a story. This is due to the fact that it is limited to one page. For more information, readers can view related reports. Power BI is the only service that offers dashboards.A single page visualization with multiple charts and graphs to tell a story is called a Power BI dashboard. This one-page visualization in a dashboard is also known as a Canvas. The Power BI dashboard is a feature only available in Power BI Service. Since a Power BI dashboard is limited to one page, it only contains the highlights of a story. You cannot create a dashboard on Power BI Desktop.
For Data Set - https://drive.google.com/drive/folder...
For Further updates on dashboard please fill this form - https://forms.gle/87fN9YoGgks9Dawx9#d... #sharepoint #dax #microsoftexcel #dados #dataviz #analisededados #sqlserver #dataanalyst #ai #crm #powerplatform #programming #erp #tecnologia #microsoftdynamics #powerquery #qlikview #inteligenciadenegocios #indicadores #microsoftteams #artificialintelligence #powerbidesktop #powerpoint #n #qlik #onedrive #it #msdyn #yammer# powerbi #microsoft #businessintelligence #excel #dataanalytics #datascience #data #tableau #datavisualization #sql #dashboard #office #analytics #python #business #dynamics #bi #software #bigdata #digitaltransformation #azure #dataanalysis #powerapps #machinelearning #technology #dashboards #microsoftpowerbi #o #cloud #businessanalytics
Доступные форматы для скачивания:
Скачать видео mp4
-
Информация по загрузке: