Our Solutions: Fluid Catalytic Cracking - improve productivity and plan maintenance efficiently
Автор: Tracerco
Загружено: 2016-02-22
Просмотров: 6792
We help you understand catalyst and process flow behaviour inside your Fluid Catalytic Cracking (FCC) unit, so you can improve productivity, identify problems and plan maintenance efficiently.
Using a gamma scan, we can measure the height of the catalyst level in the reactor or regenerator. This can help you recalibrate your level instruments and run the unit efficiently.
We pass a gamma source and detector down the side of the regenerator. The changes in signal intensity indicate the catalyst level.
We can also use a gamma scan to measure the catalyst level in the primary cyclone diplegs in the reactor or regenerator.
We pass a gamma source and detector down the side of the regenerator. The signal, shown in the video by the red line on the graph – indicates a high catalyst level in the dipleg, which is disrupting the cyclone operation.
The second scan – shown by the green line – indicates a normal dipleg catalyst level.
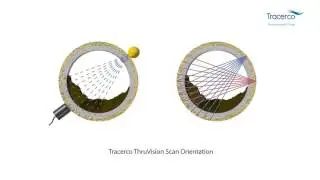
Using a ThruVision™ CAT scan, we can provide you with a detailed picture of what’s happening inside the riser. The scan produces a detailed cross-sectional density profile, to help you identify problems including catalyst maldistribution from plugged or fouled nozzles.
We take a series of overlapping scans around the circumference of the riser.
We do this at several different heights. The results here show the density profiles at the mid-riser, and above and below the feed nozzles.
Using our stationary monitoring technique, we can detect changes in the density of the catalyst as it flows through the standpipe. This gives you an understanding of any catalyst fluidization issues, so you can correct the problem.
We place a series of gamma sources and detectors along the standpipe. The changes in signal intensity indicate changes in density – a tell-tale sign of vapour bubbles or catalyst bridging in the standpipe.
Using tracers, we can measure vapour flow patterns in key places throughout the FCC. This provides you with accurate information on velocity, distribution, and residence time, allowing you to fine tune your operations and troubleshoot problems.
We put detectors at different points around the FCC unit and then introduce a vapour tracer material at the vapor inlet points.
This lets us track the vapour as it moves around the unit, so we can calculate the velocity in the riser, residence time, and other crucial metrics.
Alongside measuring hydrocarbon flow, our proven tracer studies can be used to improve efficiency by analysing the flow of the stripping steam and combustion air within the regenerator.
Introducing a vapour tracer to the stripping steam lets us calculate the steam distribution at the bottom and top of the stripper and in the reactor, the superficial velocity on each side, and the residence time.
Adding a vapour tracer to the combustion air in the regenerator means we can identify maldistribution from the air grid and to the cyclones, as well as calculate its superficial vapour velocity up the regenerator, and residence time.
Our catalyst tracer studies give you an in-depth understanding of operational and mechanical issues in your unit, including calculating important metrics like the slip factor. We can measure the catalyst velocity, distribution, and residence time in the reactor, riser, and stripper
We put detectors at different points around the FCC unit and then introduce a tracer material that attaches to the catalyst. This lets us measure the catalyst residence time, distribution and velocity in the reactor, riser, stripper.
In the same way, by using a tracer and detectors in the regenerator, we can work out the residence time of the spent catalyst, as well as the catalyst distribution at the bed level and the primary cyclone inlets.
Find out more at http://www.tracerco.com
Email us at Process.Diagnostics@tracerco.com

Доступные форматы для скачивания:
Скачать видео mp4
-
Информация по загрузке:


![Пожалуй, главное заблуждение об электричестве [Veritasium]](https://image.4k-video.ru/id-video/6Hv2GLtnf2c)