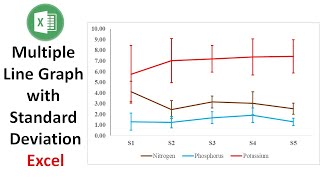
Multiple Line Chart with Standard Deviation in OriginPro
Автор: Statistics Bio7
Загружено: 2022-11-19
Просмотров: 23108
In this video tutorial, I will show you How to Draw a Multiple Line Chart with Standard Deviation in OriginPro using the Origin Pro 2022 version.
Data Requirements: XY columns.
Software Version : OriginPro 2022
Disclaimer
This Video is made for the sole Purpose of Higher Education. Care is Taken to Provide the most accurate information. However, we can’t guarantee the accuracy of all the information in this video. Kindly do your own research before coming to any conclusions or making any decisions.
#biostatistics #statistics #originpro #origin #originlab #statisticsbio7 #standard_deviation #line_graph #line_chart #line
Playlists:
OriginPro Software: • OriginPro
Past Statistical Software: • PAST - PAleontological STatistics Software
GrapPad Prism Software: • GraphPad Prism
SPSS Software: • SPSS Software
Excel Software: • Excel
BioDiversity Pro Software: • BioDiversity Pro 2.0
Minitab Software: • Minitab
Follow me:
Telegram Channel : https://t.me/statistics_bio7
Instagram: / statisticsbio7
Facebook Page: / statisticsbio7
Join this channel to get access to perks:
/ @statisticsbio7

Доступные форматы для скачивания:
Скачать видео mp4
-
Информация по загрузке: