Excel Sprint Cycle Chart in Planet Form for Agile Project Management Dashboard
Автор: Excel Visual
Загружено: 2026-01-10
Просмотров: 2299
Speed Build Video shows How to Create Interactive Sprint Cycle Chart in Excel.
Dashboard Template: https://exceltable.com/en/templates/s...
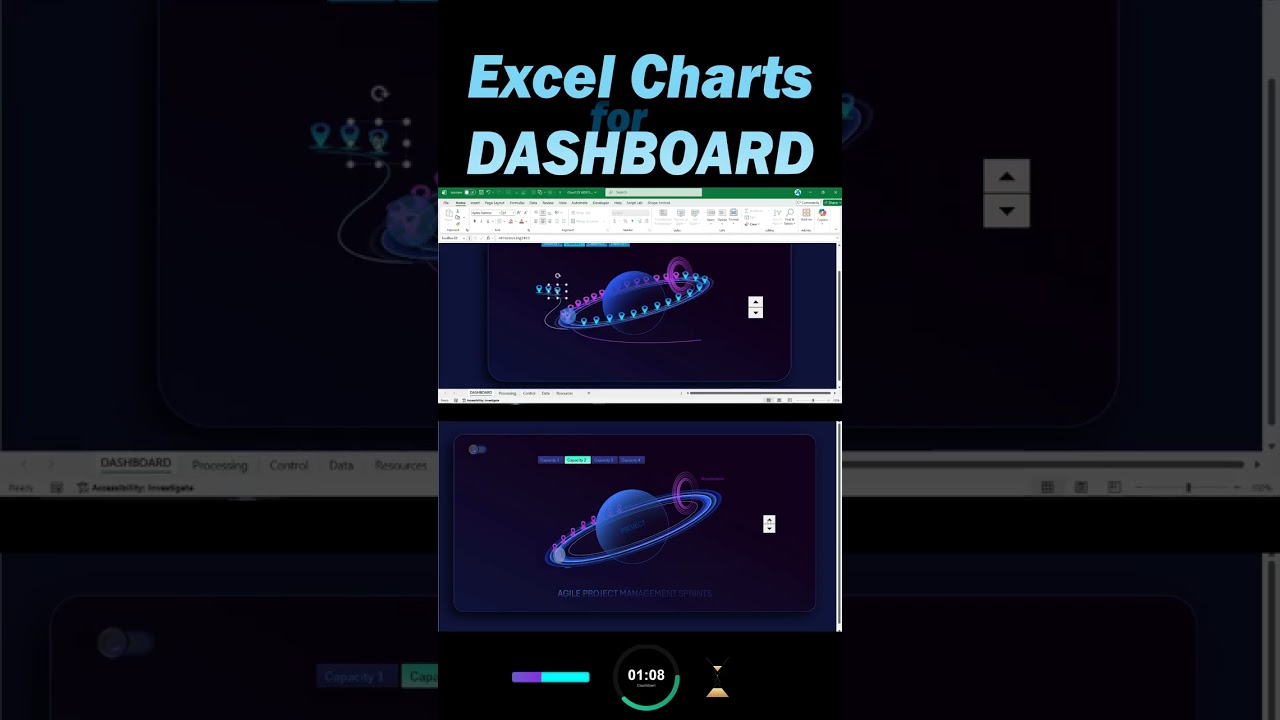
The sprint is visualized as a planet with an orbit. The planet represents the project. The orbit represents the sprint timeline. Story points move along the orbit and reflect task progression during the sprint.
The visualization follows the logic of a classic sprint chart. All workload changes are preserved. The difference is presentation. The planetary form makes sprint dynamics easier to read and more engaging for dashboards and demos.
At the center of the classic sprint diagram there is a control counter. It drives the entire dashboard. The counter allows forward and backward navigation through sprint data. A toggle switch enables or disables entry and exit from the sprint loop. This makes it possible to demonstrate both closed and open sprint cycles.
The dashboard includes several interconnected blocks for Agile analysis
✅ Sprint progress visualization with story points
✅ Employee workload and engagement tracking
✅ Team overload risk monitoring
✅ Priority based task funnel from idea to delivery
✅ Production chain performance by sprint stage
✅ Reusable resource accumulation tracking
✅ Expense level fan chart by period
✅ Interactive task burndown chart
All elements react to sprint changes and influence each other. The dashboard uses a dynamic environment metaphor. The project is the center. Tasks resources and sprints form controlled flows around it.
This Excel dashboard demonstrates how Agile project management concepts can be presented visually without losing analytical value. It is suitable for sprint reviews team discussions and Agile dashboard design inspiration.
#SprintCycleChart
Доступные форматы для скачивания:
Скачать видео mp4
-
Информация по загрузке:


![Камеди клаб [НОВЫЙ 2026] [full HD] Сборник избранных смешных и юмористических эпизодов | часть 5](https://image.4k-video.ru/id-video/hFezUJlKMmM)


